The following
animations show coupled numerical weather prediction -
wildland fire behavior model simulations of large wildfires
simulated using the CAWFE modeling
system.
2022 McKinney FireIgnition: 7/29/22 in Klamath NFThe McKinney Fire grew rapidly over its first 1.5 days, expanding over 50,000 acres in under 36 hrs, causing 4 fatalities, and producing deep convective clouds. Gusty convective downdrafts over mountainous terrain drove the fire rapidly to the east. Clouds obscured satellite detection of the fireline.  Animation - click here for mp4 of fire heat flux & near surface winds (106 Mb) Animation - click here for mp4 of fire heat flux and updrafts/downdrafts (106 Mb) |
2022 Mosquito FireIgnition: 9/30/22 near Foresthill, CASpreading along canyons containing forks of the American River, fire activity intensified producing deep pyrocumulus clouds. September 8 contained the largest day's growth, as the plume-driven southern flank expanded over 15,000 acres from afternoon into the night.  Animation - click here for mp4 (255 Mb) |
2021 Marshall FireIgnition: 12/30/21 near Boulder, COOn 12/30/21, during a downslope windstorm, at least two wildfires were reported in Boulder County, Colorado. The Middle Fork Fire ignited sometime after 10 a.m. north of the city of Boulder, near Middle Fork Road and Hwy 36, and was quickly extinguished. The Marshall Fire, reported around 11 a.m., originated south of Boulder near Hwy 93 and Eldorado Springs Dr. It spread quickly through grass, reaching the communities of Superior and Louisville in approximately an hour, transitioning into an urban fire that consumed structures throughout the day. Its spread diminished with the cessation of the downslope winds and transition to weak easterlies, increase in humidity, and finally, snowfall. This CAWFE simulation shows the evolution of the Marshall Fire throughout 12/30, along with the fire extent (inset) derived from active fire detection imagery (where red indicates active fire, brick red - previous active fire, blue - a water body, and gray - cloud) near midnight local time. While the heat signature of burning grass on clay may diminish rapidly, lingering active fire may indicate areas with the longer-burning structures. As devastating as the Marshall Fire was, even greater losses may have been averted. This simulation includes the Middle Fork Fire ignition, modeled "as if" it too had escaped. Located in a more consistently windy area north of Boulder, the CAWFE simulation indicates the Middle Fork Fire might have grown even more rapidly, swooping into and across north Longmont.  Animation - click here for mp4 (80 Mb) |
2020 Slater FireIgnition: 9/8/20 near Slater Butte lookout, Happy Camp, CAThe Slater Fire was one of hundreds to ignite during a strong easterly wind event impacting the western face of the Cascades and Sierras during Labor Day weekend 2020, culminating in over a million acres burned in CA, OR, and WA. Although driven by an easterly wind event, the fire's SE to NW path was shaped by strong, transient gusts in the lee of forested north-south ridges and flows through sheltered mountain valleys, burning from northern California into southern Oregon.  Animation - click here for mp4 (173 Mb) |
|
2020 Creek Fire
Ignition: 9/4/20
near Shaver Lake, CAIn first four days after ignition, the Creek Fire expanded 20,000-50,000 acres per day while satellite active fire detection data showed sustained active burning, indicating consumption of large fuel elements. Below is a simulation of the first day.  Animation - click here for mp4 (233 Mb) |
2020 Creek Fire
(continued)
Attributed to
strong upcanyon winds in the San Joaquin River Valley,
we find rapid growth driven in the first day by
generation of an anticyclonic mesoscale vortex
containing updraft cores (red) exceeding 25 m/s over
the fire surrounded by a ring of compensating
downdraft (blue) that rapidly pushed winds north
up the river valley. Animation - click here for mp4 (158 Mb) |
|
2007 Witch Creek Fire
Ignition:
10/21/07 east of Ramona, CAThe Witch Creek Fire, followed by the McCoy and Guejito fire ignitions (included here), were part of a late October southern California outbreak driven by a strong Santa Ana wind event producing exceptional fire growth and damage. Below is a link to a simulation of the wind event and growth from ignition. A vertical cross section of potential temperature through the ignition location suggests strong winds near the ignition were due to pressure driven flow of stable air over low aspect ratio terrain.  Animation - click here for mp4 (402 Mb) |
2018 Carr
Fire Whirl
Period: 7/26/18 Redding, CA The Carr Fire, having been driven eastward and down toward the central valley by westerlies across the coastal range, created several fire whirls, among which was a large fire whirl with winds exceeding 100 mph when entering west Redding that was detected by radar. CAWFE simulations reproduce fire growth down into Redding, and, when the fire burns across the line where two airflows intersect - the westerlies blowing downslope from the west and dry air up the Sacramento Valley - multiple strong fire whirls spin up and travel through the built areas.  Animation - click here for mp4 (96 Mb) |
|
2020 East Troublesome Fire
Visualized
period: 10/21/20 afternoon: near Granby, COThree days after it was reported on Oct. 14, 2020, high winds and low humidity allowed the East Troublesome to spread to over 10,000 acres. From Oct. 20-23, it spread dramatically, with daily increases of 18,000-87,000 acres. Below is a simulation of the day of most rapid growth, Oct. 21, 2020.  Animation - click here for mp4 (112 Mb) |
2020 Calwood Fire
Active growth:
10/17/20
afternoon: near Boulder,
COFollowing reports of an ignition near the Calwood community center, the Calwood fire ran nearly 10 km under gusty downslope winds in under 3 hr to Highway 36 along the Front Range, threatening WUI communities, until winds subsided as a weak cold front approached (from upper right).  Animation - click here for mp4 (52 Mb) |
|
2020 North Complex (Bear
Fire)
Simulation
period: 9/8/20 1 a.m. - afternoon
9/9/20 near Quincy, CA and
Oroville, CAOn its way to becoming one of the largest fires in California history, the North Complex (composed of multiple fires, most of which were suppressed, but the Claremont/Bear fires merged) grew by over 210,000 acres on 9/8-9/9, driven by strong northeasterly winds. CAWFE simulations show these were concentrated in the river valley of the Middle Fork of the Feather River, with strong pulsing gusts present over the lower foothills above and near Oroville.  Animation - click here for mp4 (145 Mb) |
2018 Woolsey Fire
Simulation
period: 11/8/18-11/9/18On the same day as the Camp Fire, ignitions on the Santa Susanna Field Laboratory site spread rapidly under strong Santa Ana winds to the south to the Ventura Freeway during this period, which it later crossed overnight, into the Santa Monica Mountains. This simulation shows a river of strong winds coming off the Santa Susanna Mountains to the northeast, generating pulses of winds particularly over the mountainous bridge connecting them to the Santa Monica Mountains. The fast spread and weaker heat flux reflects the fast-running fires of sparsely vegetated chaparral-covered terrain.  Animation - click here for mp4 (209 Mb) |
|
2018 Thomas Fire
Ignitions: 12/4/18 6:26 PM and 7 PM
near Santa Paula, CA
Two ignitions during a strong, long-duration Santa Ana wind event set off the Thomas Fire. During the initial run, the two ignitions merged and the fire raced through Ventura county toward the ocean, driven by winds down the Santa Clarita River Valley and over the southern Sierra Nevada mountains. This period is characterized as a "wind-driven event".  Figure T1. CAWFE simulation of the first day of the Thomas fire at midnight Dec. 5, 2017. Heat flux from fire (in W/m-2) is colored according to upper color bar. Wind speed arrows (in m s-1) point downstream and are colored according to the lower color bar at right. Animation - click here for mp4 (247 Mb) |
2018 Thomas Fire
(continued) During later periods, the Santa Ana event
waxed and waned, varying in where and when strong
winds reached the surface. In addition, the fire
spread into the mountains north of the river valley,
drawing itself up canyons and bowls sheltered from the winds.
 Figure T2. CAWFE simulation of the Thomas fire on 12/8/17 at 4 PM PDT.. Heat flux from fire (in W/m-2) is colored according to upper color bar. Wind speed arrows (in m s-1) point downstream and are colored according to the lower color bar at right. Animation - click here for mp4 (124 Mb) |
|
2013 Rim Fire
Ignition: 8/17/13 near Yosemite, CA
The Rim Fire was a massive plume-driven wildfire that experienced days of over 37,000 and 51,000 acres of growth, despite relatively weak ambient winds.  Figure R1. CAWFE simulation of the 8/20/13-8/21/13 rapid expansion of the Rim Fire, initialized with the NIROPs fire map on late 8/20/13. Heat flux from fire (in W/m-2) is colored according to upper color bar. Wind speed arrows (in m s-1) point downstream and are colored according to the lower color bar at right. The misty field indicates smoke concentration. Animation - click here for mp4 (90 Mb) |
2016 Chimney Tops 2 Fire
Ignition: Reported on 11/23/16
in Great Smoky Mountains National Park, TN
The Chimney Tops 2 Fire was one of several fires that burned in North Carolina and Tennessee during a very dry fall in the Appalachian Mountains. While foehns (downslope windstorms) are well known in other regions, conditions created an extremely strong downslope wind event that drove a pre-existing fire down through the city of Gatlinburg, TN.  Figure CT1. CAWFE simulation of the day of rapid growth of the Chimney Tops 2 Fire in Great Smoky Mountains NP down into the town of Gatlinburg, TN (foreground).. Heat flux from fire (in W/m-2) is colored according to upper color bar. Wind speed arrows (in m s-1) point downstream and are colored according to the lower color bar at right. Animation - click here for mp4 (47 Mb) |
|
2018 Camp Fire
Ignition: 11/8/18 near Paradise, CA
On November 8, a strong Diablo wind event created strong winds over the Sierra Nevada Mountains, with locally strong winds near the Jarbo Gap and Feather River Canyon. Research simulations using CAWFE showed that extreme winds, created by a shear instability along the top of a shallow, near-surface stable layer (a phenomena that resembles backwards-breaking waves) brought strong winds crashing to the surface, driving the fire rapidly down the slope. (Fig. C1)  Figure C1. CAWFE simulation of the Camp Fire. The fire's heat flux is show in the upper color bar (in W m-2). Wind speed arrows (in m s-1) point downstream and are colored according to the color bar at right. Vectors are shown every 3 grid points. Animation - click here for mp4 (59 Mb) |
2018 Camp Fire
(continued)
This vertical cross section down the center of the fire shows the shear instability as rapidly spreading heavy air (lower potential temperatures) is lifted into slower moving air above it, creating the impression of retroflecting (backwards breaking) waves (Fig. C2). As strong winds are crash down to the surface, they spread outward in scallops of strong winds that drove the fire rapidly down slope (Fig.C1, at left.)  Figure C2. CAWFE simulation of the Camp Fire. The fire's heat flux is show in the upper color bar (in W m-2). Wind speed arrows (in m s-1) point downstream and are colored according to the color bar at right. Vectors are shown every 3 grid points. Animation - click here for mp4 (15 Mb) |
|
2017 Redwood Valley Fire
Ignition: 10/8/17 near Potter Valley,
CA
On October 8-9, 2017, fourteen large wildfires developed rapidly during a strong Diablo wind event in northern California including the Redwood Valley Fire. Diablo winds travelled south down the Sacramento Valley. The flow was pushed through gaps between ridges, creating narrow rivers of strong winds the peaks of which reached 30-40 m s-1 amidst areas where winds were weak or stagnant.  Figure R1. CAWFE
simulation of the Redwood Valley Fire. The fire's
heat flux is show in the upper color bar (in W m-2).
Wind speed arrows (in m s-1)
point downstream and are colored according to the
color bar at right. Vectors are shown every 3 grid
points.
The Redwood Valley Fire had two nearby ignitions on the west side of the Potter Valley (the grass green area in center of Fig. R1). Driven by a shallow river of strong winds, within hours, it crested a ridge and raced down through populated lots into the Redwood Valley. Animation - click here for mp4 (52 Mb) |
2017 Tubbs Fire
Ignition:
10/8/17 near Calistoga, CACoen, J. L., W. Schroeder, and B. Quayle, 2018: The generation and forecast of extreme winds during the origin and progression of the 2017 Tubbs Fire. Atmosphere, 9, 462. PDF Here, we applied CAWFE to investigate the flow regime and underlying mechanisms associated with the extreme winds and fire behavior during the Tubbs Fire.  Figure. CAWFE simulation
of the Tubbs Fire at 4:11 AM PDT. The fire's heat
flux is show in the upper color bar (in W m-2).
Wind speed arrows (in m s-1)
point downstream and are colored according to the
color bar at right. Vectors are shown every 3 grid
points.
As Diablo winds
travelled south down the Sacramento Valley and fanned
out southwestward over Wine Country, their strength
waxed and waned and their direction wavered, creating
varying locations near fire origins where wind
overrunning topography reached 30-40 m s-1.
The flow created peak wind speeds exceeding 40 m s-1
at the crest of some lesser hills. The flow drove the
Tubbs Fire over 19 km in 3.25 h into urban areas of
Santa Rosa, CA.Animation - click here for mp4 (19 kb) |
|
2014 King Fire
Ignition:
9/13/14 near Pollock Pines, CACoen, J. L., E. N. Stavros, and J. A. Fites-Kaufman, 2018: Deconstructing the King megafire. Ecological Applications. doi:10.1002/eap.1752. The King Fire was ignited at 6:37
PM on Sept. 13, 2014, spread during a severe drought
in the central Sierra Nevada mountain range in complex
terrain covered by mixed conifer forests, which
generates complex fuel beds shaped by drought, land
management practices (e.g. forest cultivation and
harvesting, fire suppression, and fuel mitigation),
and burn scars from previous fires. The King fire grew
7 km to the northeast through the evening of Sept. 16
as nearby surface weather stations recorded weak to
moderate south-south-westerly winds upon which weak
diurnal circulations and gusts of 2-10 m s-1
were superimposed.
From 9:49 PM Sept. 16, when the fire was mapped by the National Infrared Operations (NIROPs) airborne imager, until 1:06 PM Sept. 17, when satellite active fire detection data detected the fire entering the Rubicon Canyon, the fire traveled north over rolling hills. In an afternoon run that was unanticipated in light of weak to moderate ambient winds, the fire grew over 16,200 ha (40,000 acres), racing approximately 25 km to the northeast over the next 11 h – an average spread rate of 2.3 km h-1 – following the canyon to its crest at Hell Hole Reservoir, where growth stalled.  Figure. CAWFE simulation
of the King Fire from 9:45 PM Sept. 16 to 4:42 AM
Sept. 18. The simulated total heat flux in
(colored according to color bar at right, in W m-2)
is shown on the surface, along with wind vectors
(plotted every 4th grid point) at 21 m
above ground level. In the animation, each frame
is one minute apart.
Animation - click here for mp4 (259 Mb) |
2013 Yarnell Hill Fire
Ignition:
6/28/13 near Yarnell, Arizona. Simulation of 6/30/13Coen, J. L. and W. Schroeder, 2017: Coupled Weather-Fire Modeling: from Research to Operational Forecasting. Fire Management Today. 75:39-45. On June 30, 2013, 19 firefighters were killed during the Yarnell Hill fire, when a gust front from the northeast blew across the fire, changing its direction, and making it spread rapidly across where they were sheltered. The animation depicts a CAWFE simulation of June 30 (370 m horizontal grid spacing), from 2 am - 8:15 PM local time. The fire is initialized in the model using the 3 AM VIIRS active fire detection map. Each frame is 1 minute apart. In the simulation, solar heating stirs up the boundary layer circulations throughout the day. Convection occurs in outer domains (not shown) to the northeast (upper right), creating high-based convective clouds as upper level air flows southeast over the Mogollon Rim. Rain falls into a very dry boundary layer, creating a broad gust front that reaches the south edge of the fire at frame 936. The fatality occurred around 4:45 PM. Comparison with the fatality report suggest the simulated timing for the gust front reaching the northeast edge of the fire and the fatality site are within 15 minutes of occurrence. 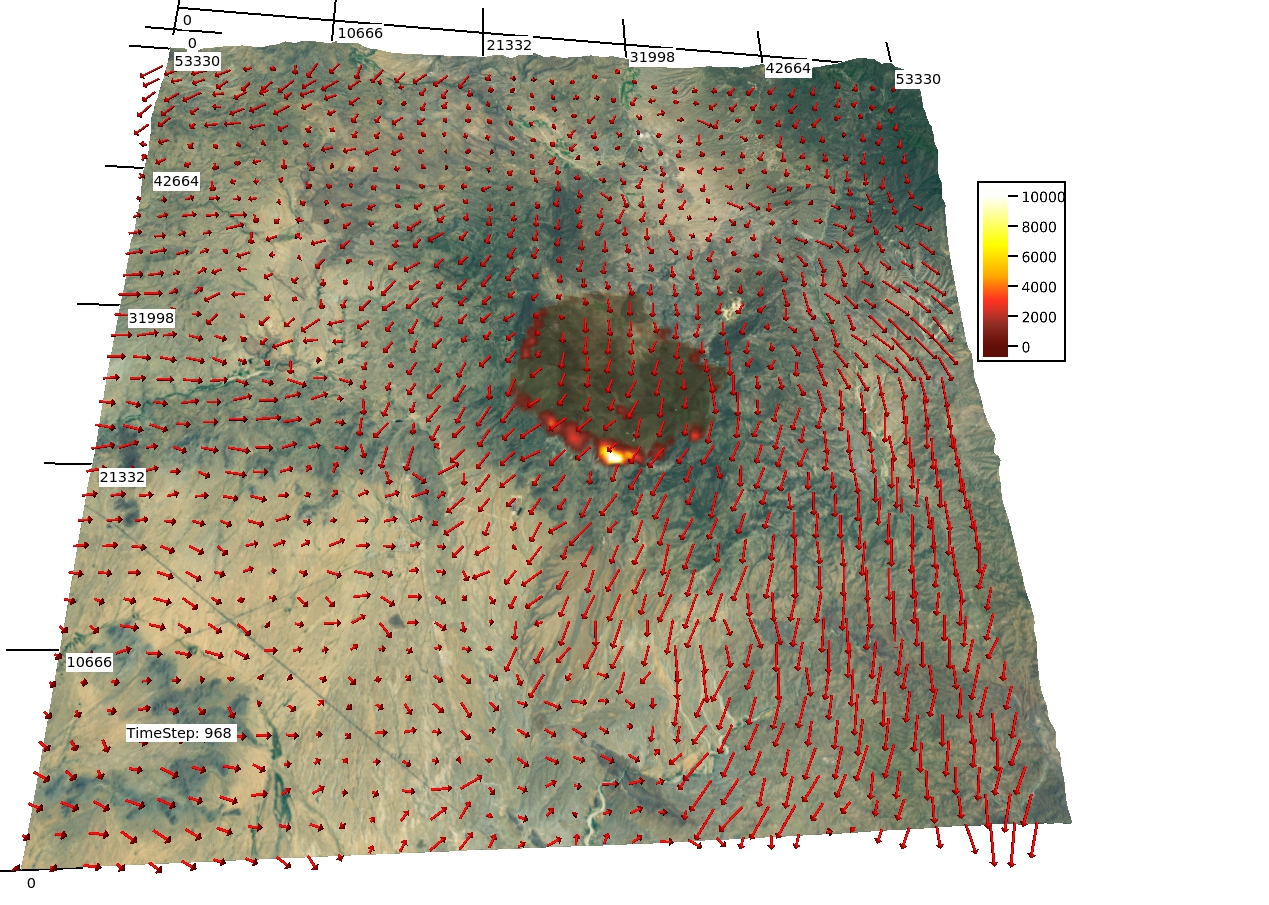 Figure. CAWFE coupled weather-wildland fire model simulation of the Yarnell Hill Fire. The color bar on the right indicates the heat flux (watts per square meter) from the fire, with more intensely burning areas in bright yellow and white, and less intensely burning areas in darker reds.A vector is shown each 4 model grid points. Animation - click here for mp4 (5.9 Mb)
|
|
2012 Little Bear Fire
Ignition:
6/4/12 near Ruidoso, NMCoen, J. L. and W. Schroeder, 2013: Use of spatially refined remote sensing fire detection data to initialize and evaluate coupled weather-wildfire growth model simulations. Geophys. Res. Lett. 40:5536-5541. The Little
Bear Fire was ignited by lightning strike in the
Sierra Blanco Mountains of New Mexico. It burned
17,939 ha (44,330 ac) and 254 buildings and was the
most destructive fire in New Mexico State history.
|
2012
High Park Fire
Ignition: 6/7/12 near Fort
Collins, COCoen, J. L. and W. Schroeder, 2015: The High Park Fire: Coupled weather-wildland fire model simulation of a windstorm-driven wildfire in Colorado's Front Range. J. Geophys. Res. Atmos. 120:131-146 The High Park fire is reported to have been ignited by lightning strike. It grew rapidly during a Colorado Front Range downslope windstorm, destroying 259 homes and burning 87,284 acres. 
View: towards
the north. Fort Collins lies to the right, and
Poudre Canyon is the northernmost boundary of this
domain. Each frame is a minute apart, the total
animation covers the local time from 5:45 am 6/9/12 to
3:00 am 6/10/12. The misty field represents smoke,
colored by concentration - higher concentrations are
more opaque (linearly with concentration) and darker.
The colors identifying the burning parts of the fire
are the sensible heat fluxes released by the fire (see
color bar to right, in W/m^-2). Darker browns
are lower fluxes. The surface appears dark brown
where fire has passed. Red arrows represent the
near-surface horizontal wind speed (the length of the
arrow) and direction (the arrows point downwind). |
|
2007
Esperanza Fire
Ignition: 10/26/07 near the Banning Pass, Cabazon, CA Coen, J. L. and P. J. Riggan, 2014: Simulation and thermal imaging of the 2006 Esperanza wildfire in southern California: Application of a coupled weather-wildland fire model. International Journal of Wildland Fire 23, 755-770. The Esperanza fire was ignited on the upwind edge of the San Jacinto mountains during dry, windy Santa Ana conditions. The following simulations show the winds near the surface and fire growth. This work was the first to simulate simultaneously the evolving meteorological flow, fire behavior, and fire-induced flow for a landscape-scale naturally evolving fire. It captures the rapid spread of the fire to the west-southwest driven by both Santa Ana winds and topographic effects, recreating the splitting of the fire, feathering at the leading edge, and other distinctive features. For infrared imagery of this fire from research aircraft, see http://fireimaging.com/ . The simulation was visualized using VAPOR producing the animations below.  View: towards the south. Cabazon, CA, is in the foreground. Each frame is a minute apart, the total animation covers the local time from 1:30 am 10/26/06 till 8 PM. The misty field represents smoke, colored by concentration - higher concentrations are more opaque (linearly with concentration) and darker. The colors identifying the burning parts of the fire are inspired by the radiant temperature color bar at fireimaging.com - brighter colors like yellow reflect higher surface fire sensible heat fluxes (see color bar to right). Darker browns are lower fluxes. The surface appears dark brown where fire has passed. The boxiness to the fireline shows the atmospheric grid sizes, onto which the fire fluxes on the fire fuel cell scale (5x5 within each atmos cell) have been summed. Animation - click here for mp4 (8.7 Mb) |
2002
Big Elk Fire
Ignition: 7/17/02 near
Pinewood Springs, COCoen, J. L., 2005: Simulation of the Big Elk Fire using coupled atmosphere-fire modeling. International Journal of Wildland Fire 14, 49-59. This
simulation shows several hours in the early period of
the Big Elk Fire, a 4400 acre wildfire ignited by a
tailpipe. Fire behavior was extreme reflecting
the extremely dry conditions throughout Colorado
(including the lowest fuel moistures ever recorded in
the area). Initial spread was rapid, moving up a south
slope of ponderosa pine mixed with Douglas fir with
crowning and torching into high density thin-stemmed
lodgepole pine at upper elevations. The red
field shows where the air was warmed at least 10
degrees by the heat released from the fire. The
misty white field represent smoke, with denser areas
representing higher concentrations. The arrows
show the wind speed (shown by the length of the arrows
- longer arrows being stronger winds) and direction
near the surface. This case represents a
relatively simple scenario, with no large-scale
weather features - winds were driven primarily by
solar heating of mountain slopes, producing weak
afternoon upslope conditions during the active fire
periods. 
|

Keywords: wildfire model, fire behavior, forest fires, fire model, wildland fire model, wildfire prediction, fire growth, fire simulation