 |
|||||
| Episodes Home | Docs and Reports | Access Data | Collaborators | ||
|---|---|---|---|---|---|
|
Inferences of Predictability Associated with Warm Season Precipitation Episodes
R. E. Carbone, J. D. Tuttle,
D. A. Ahijevych, S. B. Trier
Journal of the Atmospheric Sciences Table of Contentsa. Literature review 2. Radar observations and data processing a. Radar product
data 3. Examples of Coherent Rainfall Pattern a. Spring a. Echo frequency
diagrams 5. Rain Streaks and Related Statistics a. Span-duration
statistics a. Principal findings Table 1. Rain Streak Zonal Span and Duration Table 2. Rain Streak Zonal Phase Speeds Table 3. Rain Streak Zonal Propagation (m s-1)
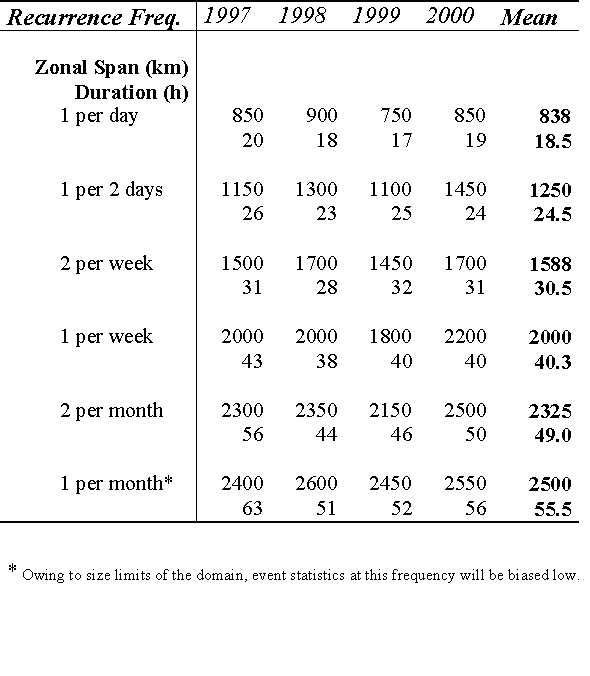
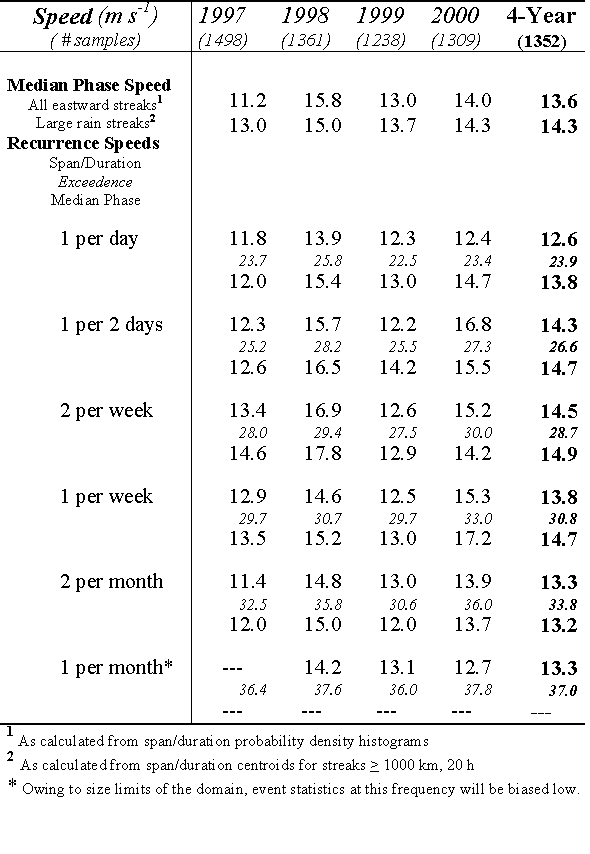
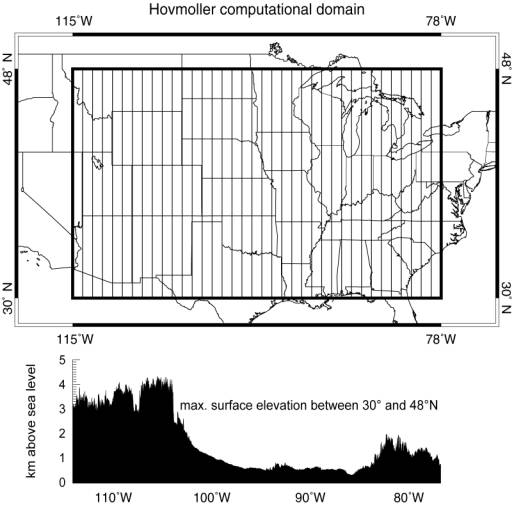
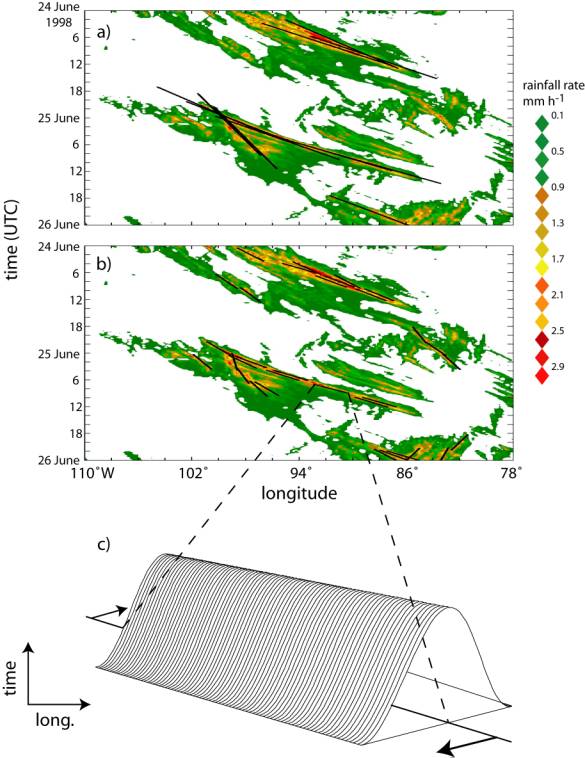
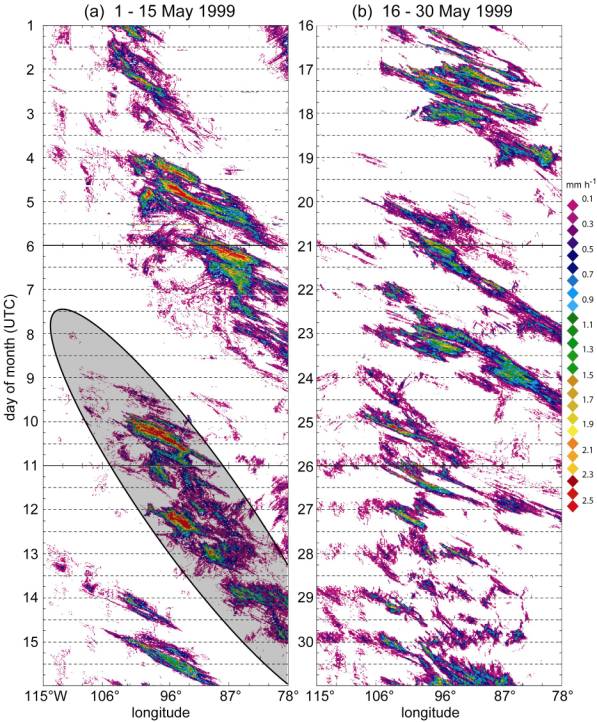
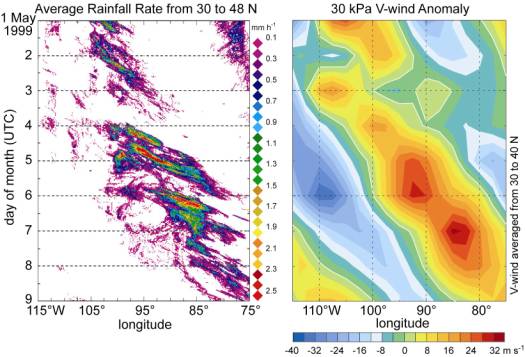
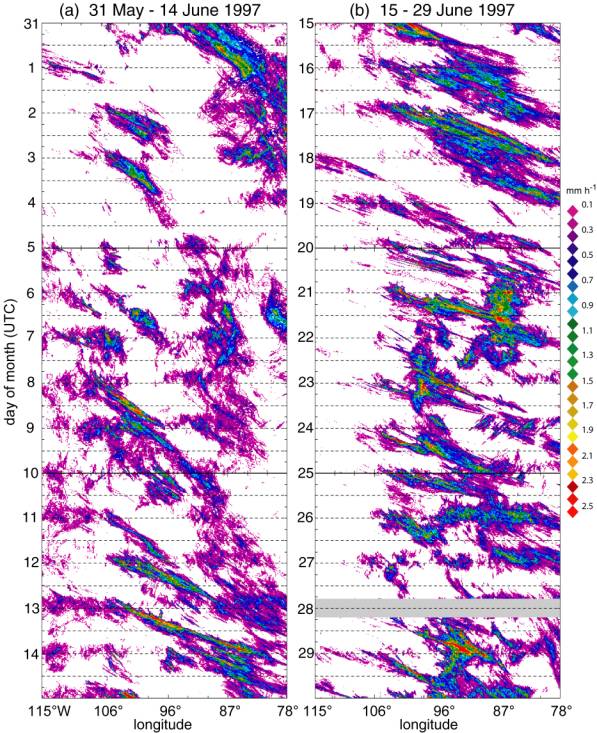
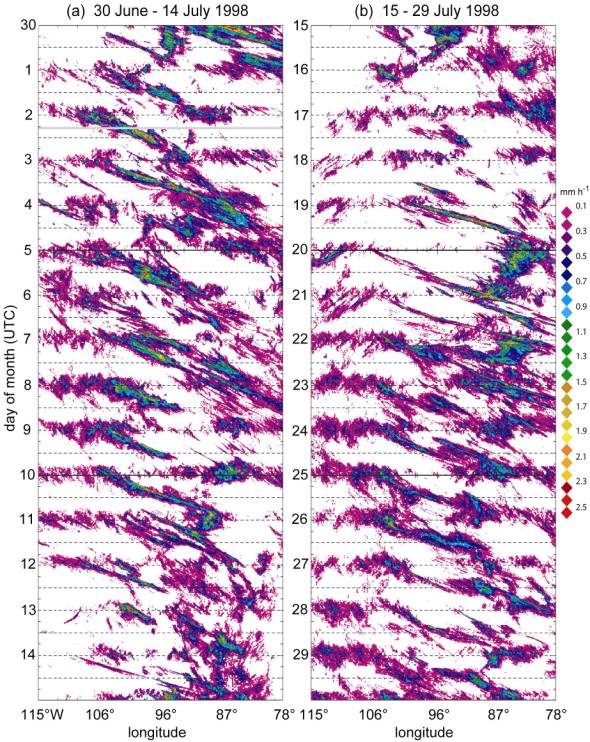
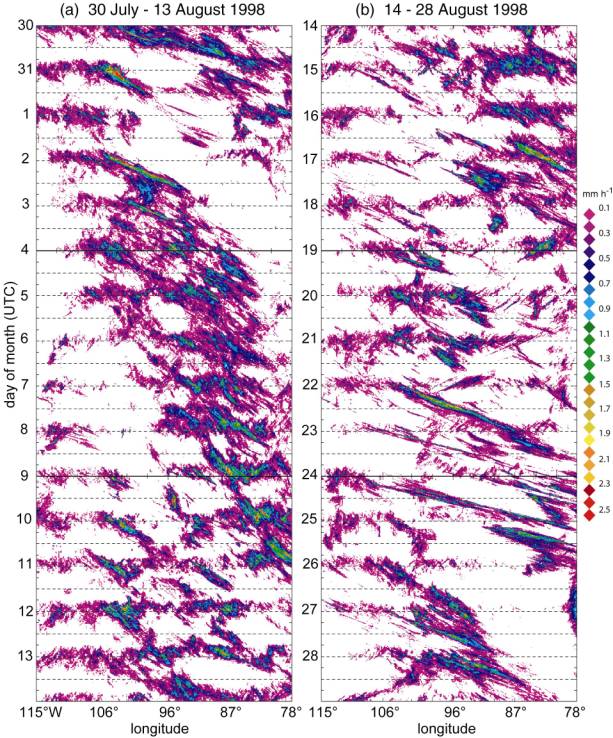
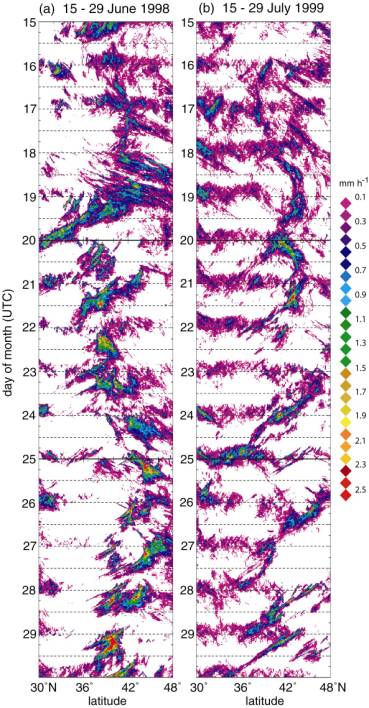
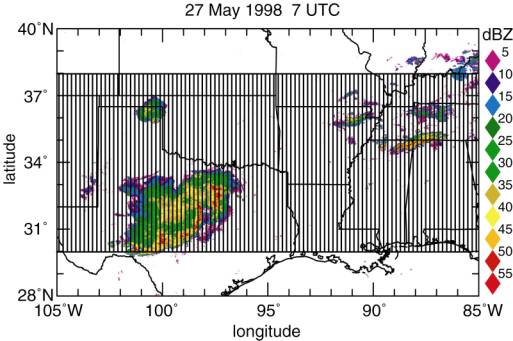
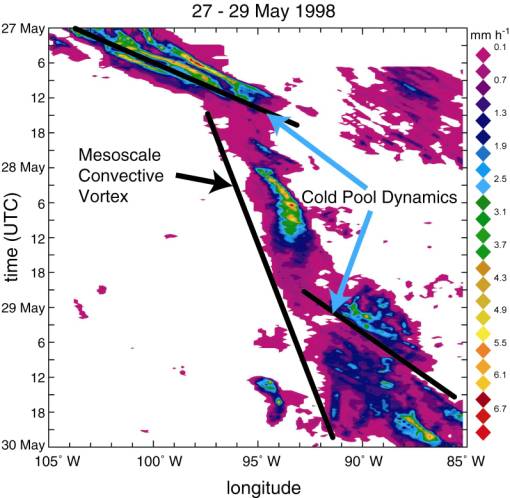
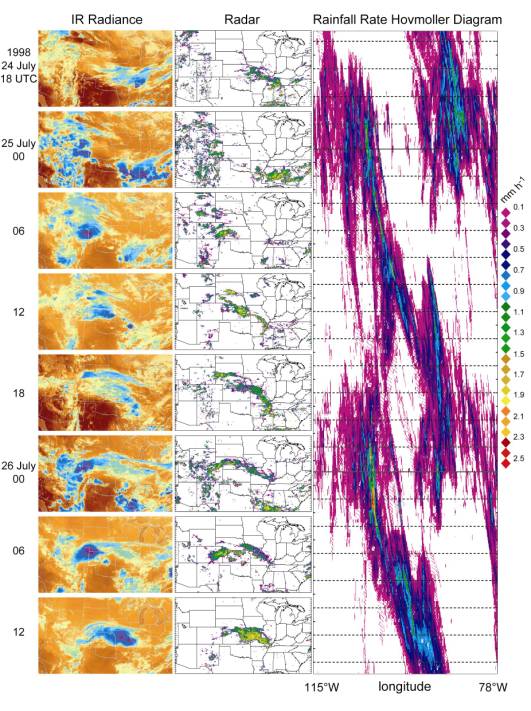
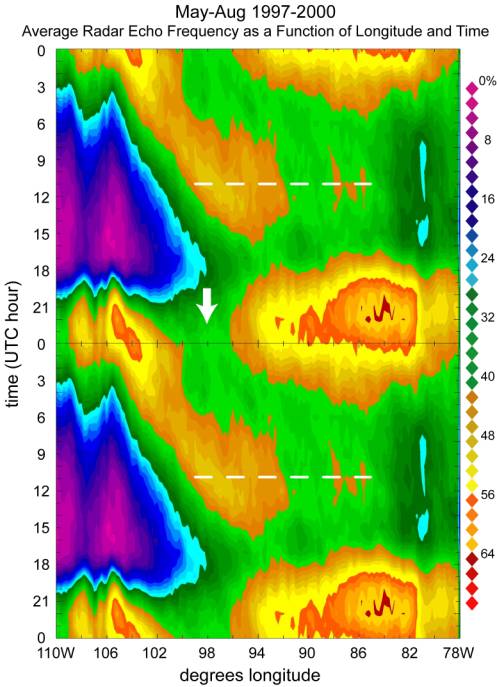
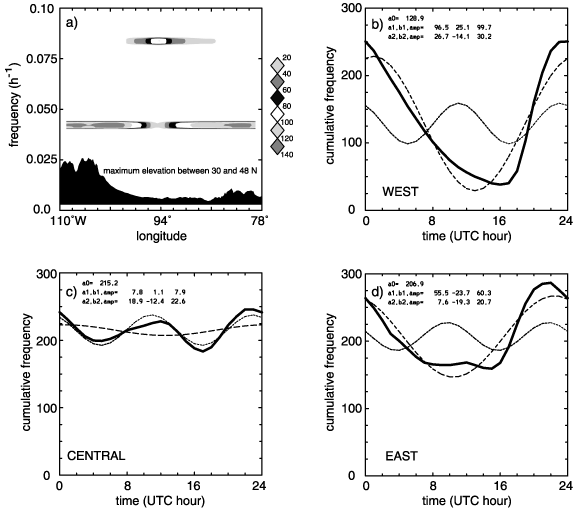
AbstractHerein we report preliminary findings from a radar-based climatology of warm season precipitation "episodes." Episodes are defined as time/space clusters of heavy precipitation that often result from sequences of organized convection such as squall lines, mesoscale convective systems and mesoscale convective complexes. Episodes exhibit coherent rainfall patterns, characteristic of propagating events, under a broad range of atmospheric conditions. Such rainfall patterns are most frequent under "weakly forced" conditions in mid-summer. The longevity of episodes, up to 60 h, suggests an intrinsic predictability of warm season rainfall that significantly exceeds the lifetime of individual convective systems. Episodes are initiated primarily in response to diurnal and semi-diurnal forcings. Diurnal forcing is dominant near the Rockies and Appalachians whereas semi-diurnal forcing is dominant between these cordilleras. A most common longitude of origin is at or near the east slope of the continental divide (105 W). These observations are consistent with a condition of continual thermal forcing, widespread hydrodynamic instability, and the existence of other processes that routinely excite, maintain and regenerate organized convection. The propagation speed of major episodes is often in excess of rates that are easily attributable either to the phase speeds of large scale forcing or to advection from low- to mid-level "steering" winds. We speculate that wave-like mechanisms, in the free troposphere and/or the planetary boundary layer, may contribute to the rates of motion observed. Once understood, the representation of such mechanisms offers the opportunity for improved predictions of warm season rainfall from forecast models at all ranges. 1. IntroductionThe skill associated with warm season rainfall predictions is low, both by absolute standards and relative to predictions of cool season precipitation (Olson et al., 1995). Our main purpose is to report the existence of coherent warm season precipitation patterns that are continental in scale and exhibit durations well in excess of typical mesoscale convective lifecycles. We refer to the coherent rainfall patterns as "episodes" to draw a distinction between the largest and longest duration events and individual convective systems. The time/space coherence of precipitation patterns is suggestive of a heretofore unrecognized intrinsic predictability associated with warm season rainfall. Herein, we provide a basic statistical description of precipitation episodes for the warm seasons 1997-2000, as derived from continent-scale analyses of WSR-88D radar data at 2 km horizontal resolution. We have not attempted a dynamical diagnosis of the coherent precipitation patterns, though we discuss some candidate mechanisms in light of the observations. Provided the causes for rainfall coherence can be described dynamically and adequately represented in models, an improved basis for specific predictions at 6 to 48 h range can be established. Furthermore, statistical-dynamical techniques may be developed for time scales up to seasonal when associated with quasi-stationary forcings such as orography and the North American monsoon circulation. Subsequent publications will delve into the dynamical and predictability issues by various means, including observationally-based case studies, idealized simulations, and experimental numerical predictions. Since we exhibit only a small fraction of the time series discussed herein, a companion Technical Note (Ahijevych et al., 2001) has been compiled and is now available from the National Center for Atmospheric Research. A website, containing all of the charts and links or instructions for access to base data, is maintained here. a. Literature reviewSeveral studies have focused on regional-scale forcings of warm season precipitation over the continental United States. Palmen and Newton (1969) describe a pronounced nocturnal maximum and afternoon minimum in thunderstorm frequency from Texas to Minnesota and attributed this, in part, to eastward movement of squall lines from formation regions in the Rocky Mountains. Wallace (1975) identified systematic diurnal variations in precipitation and thunderstorm frequency using conventional hourly data. Boundary layer convergence was attributed to at least three mechanisms, including sea/land breezes; heating over sloped terrain (Holton, 1967; Lettau,1967); and changes in frictional drag associated with diurnal variation of static stability (Blackadar, 1957). Wallace concluded that the central U.S. nocturnal maximum in convective activity was a direct consequence of the combined effects of heating over sloped terrain and changes in frictional drag. This was considered especially significant in the southern Great Plains under SW flow and was associated with the low-level jet (Bonner, 1968). More recently, Dai et al.(1999) analyzed diurnal variations in precipitation, surface pressure and static energy over the U.S. from observations and a regional climate model. They found that the solar-driven diurnal and semi-diurnal cycles of surface pressure result in large scale convergence over most of the western U.S. during the day and east of the Rockies at night, thereby suppressing daytime convection and favoring nocturnal convection east of the Rockies. The extent to which warm season precipitation is intrinsically predictable is limited by the non linear and chaotic nature of convective storms. To some extent, the degree of predictability is dependent upon the longevity of coherent rainfall events. Apart from hurricanes, the longest reported duration of organized convective systems is associated with mesoscale convective complexes, MCCs (e.g. Maddox, 1980, 1983; Velasco and Fritsch, 1987; Miller and Fritsch, 1991; Laing and Frisch, 1997; Laing and Fritsch, 2000). As defined by satellite imagery-based criteria, MCCs have average lifetimes of 8 to 12 h in the Americas, China, Africa and Australia. Most of these systems originate in the lee of steep topography; have an equatorward source of moist static energy; and produce most of their precipitation at night. Often these regions have distinct flow regime characteristics such as a low level jet, a strong humidity gradient zone, and a quasi-stationary front, all of which are common to central North America. In addition, MCCs often initiate equatorward of an upper level jet under divergent flow aloft (Uccellini and Johnson, 1979). The propagation of rainfall areas is intimately linked to the maintenance of deep convection and the longevity of mesoscale systems. Traveling convection may be influenced by ambient tropospheric winds, vertical wind shear, negative buoyancy production (in the lower troposphere) and positive buoyancy production (in the middle/upper troposphere). In weakly-sheared environments and in deep westerly shear at mid-latitudes, individual convective storms tend to travel with "steering level" winds near 70 kPa (e.g. Ligda and Mayhew, 1954; Houze, 1993). In jet-type profiles, where the direction of the vertical shear vector reverses, mesoscale convective systems tend to travel in the direction of the jet, and move at a speed slightly in excess of the jet maximum. This is particularly common in the tropical easterlies where a jet often exists near 70 kPa (e.g. Barnes and Sieckman, 1984; Keenan and Carbone, 1992). Mechanisms governing the sustained motion of organized convective systems may be essentially external or internal to a moist mesoscale circulation. Internal mechanisms include shear-balanced gravity current propagation (e.g. Thorpe et al., 1982; Rotunno et al., 1988); excitation of trapped gravity waves in the nocturnal boundary layer (e.g. Crook, 1988; Raymond and Rotunno, 1989; Carbone et al., 1990; Crook et al., 1990; Koch et al., 1991); and propagating gravity waves produced by the convective heating aloft (e.g. Moncrieff and Miller, 1976; Raymond, 1984; Raymond, 1986; Lin and Li, 1988; Tripoli and Cotton, 1989). Any of these mechanisms offer potential explanation for convective system propagation rates that may exceed ambient winds. At mid-latitudes, especially in spring and early summer, convection is often associated with baroclinic waves, extra-tropical cyclones and fronts. The propagation of such "strongly-forced" systems should be consistent with the (external) phase speed of synoptic forcing. This phase relationship to synoptic scale features, while often investigated with respect to genesis of individual convective systems, has not been systematically examined with respect to the lifecycle of coherent convective rainfall episodes. Coherent regeneration of rainfall systems is yet another aspect of rainfall episodes, especially when such episodes exceed the duration of individual convective systems. Regeneration is often associated with drylines, colliding mesoscale "boundaries" (Wilson and Schreiber, 1986), gravity currents, bores, solitary waves, and other forms of trapped gravity waves (Carbone et al., 1990; Crook et al. 1990). Koch and O’Handley (1997) identified mesoscale gravity waves in unbalanced flow at the synoptic scale as a regeneration mechanism. Recent investigations have firmly established the significant role of mesoscale convective vortices (MCVs) in convective regeneration (Fritsch.et al., 1994; Trier et al., 2000a; Trier et al., 2000b and Davis et al., 2001). b. General approachOur strategy is to apply very simple treatments to massive quantities of data over a continent-scale domain. The analyses are based exclusively upon U.S. National Weather Service and related operational data. We have acquired a warm season time series (1997-2000) from the WSR-88D (NEXRAD) Doppler radar network, Geostationary Operational Earth Satellite (GOES) rapid scans (1998-2000), all analyses and observations available via NOAA's Family of Services, National Centers for Environmental Prediction (NCEP) 2.5° Daily Data, and UHF wind profiler data from the NOAA profiler network. The focal point of this paper is examination of WSR-88D national composite data from 1997 to 2000. While WSR-88D data are limited in their capacity to represent local rainfall rates or cumulative rainfall amounts (e.g. Klazura et al., 1999), these are satisfactory to identify practically all areas that experience precipitation east of the continental divide. While observational gaps exist west of the divide, the fractional area of coverage is sufficiently large to permit detection and tracking of major mesoscale events. We examine these data with respect to space/time coherency given the tacit assumption that coherency provides clues as to the spatial and temporal scales of intrinsic predictability. A smoothly varying continuum of precipitation in time-space infers potential for developing predictive skill, however, this property alone might prove to be insufficient. Section 2 describes properties of the data, procedures associated with calculations, and the presentation of quantities derived from these calculations. Section 3 provides examples of coherent rainfall regimes by means of Hovmoller (mainly time-longitude) diagrams. The emphasis is on intra-seasonal and regional variations over the four-season period of record. Section 4 examines the periodicity of rainfall within and beyond the diurnal cycle. Section 5 provides probability density functions of rainfall episodes and statistics related to the their translation and propagation. Section 6 discusses the potential relevance of various mechanisms governing the forcing, maintenance, propagation, and regeneration of convection and their relationship to some newly recognized characteristics. 2. Radar observations and data processinga. Radar product dataWe define the "warm season" as May through August and we have compiled data for seasons 1997 through 2000. All statistics presented herein encompass the computational domain (Fig. 1) for these 16 months. Our principal focus is the exploitation of information from a WSI Corporation NOWradTM (national composite) product that has benefited from three levels of quality control. Products such as NOWradTM, while inadequate for some research purposes, have been the only practical vehicle for access to complete spatial and temporal coverage at high horizontal resolution within the WSR-88D network. The properties of this NOWradTM product include a ~2 km latitude/longitude grid with 15 min. resolution and 16 levels of radar reflectivity factor data (10 log Ze (mm6 m-3)) at 5 dBZe intervals. The precise algorithm for creating this composite is information proprietary to WSI Corporation. It is commonly described as the maximum value of dBZe as measured by any WSR-88D radar at any height in a vertical column. Figure 1. Computational domain for radar-rainrate Hovmoller diagrams. For clarity, subdivisions are shown with 1° vertical strips whereas, in actuality, there are 740 strips of width 0.05° (~4 km). Diurnal echo frequency diagrams use a similar domain with a western boundary at 110 W. The sensitivity of WSR-88D is high, equivalent to rainfall rates < 0.1 mm h-1. Signals this weak may not always represent water mass that reaches the ground and some of the weak signals can originate from insects, seeds and birds. A more serious problem for quantitative use of these data is the error that results from quantization, which corresponds to a factor of two in rainfall rate. It is well known that reflectivity-rainfall rate (Z-R) relationships are locally uncertain on several accounts, including the fact that equilibrium drop-size distributions are uncommon within mid-latitude convection (e.g. Carbone and Nelson, 1978). Given these and other considerations, the averaged "rainfall rates" illustrated in Section 3 should be viewed in relative terms, i.e., to indicate locally light or heavy rainfall, amplification and dissipation. b. Hovmoller diagrams of rainfall episodesTime-distance plots (often referred to as "Hovmoller diagrams") are commonly used for the diagnosis of coherent signals in climate science (e.g. Nakazawa, 1988). Carbone et al. (1998), Knupp et al. (1998), and Wilson et al. (2001) have recently applied this tool at the mesoscale to study the lifecycle of precipitation systems using Doppler radar data. The standard approach is to apply a power-law transformation, Ze = aRb, in order to linearize the signal with respect to rainfall rate where 1.2 < b < 1.8. The coefficient, a, is typically 150-400 where rainfall rate, R, is expressed in mm h-1. Herein, we have set the coefficients a = 300 and b = 1.5 since these values render a relatively small net bias in the global average when compared to national analyses of rainfall (Klazura et al., 1999). While local biases may exceed a factor of two, the reader should be mindful that rainfall estimation per se is peripheral to our application. Most of our diagrams exhibit longitude as the distance dimension, since this is the principal direction of precipitation system motion over North America. Figure 1 is the domain of computation (~3300 by 1800 km). The 1° longitude vertical columns are symbolic of meridional averaging intervals, which are actually 0.05° (~4 km) wide. The estimated rainfall rate is arithmetically averaged over each column (~1800 km). We have performed various calculations from the Hovmoller diagrams for the purpose of quantifying event coherency, longevity, zonal distance (hereinafter referred to as "span") and the zonal component of propagation. Two-dimensional autocorrelation functions are fit to the rainfall data in Hovmoller space (Fig. 2). The function is rectangular in one dimension and cosine-weighted in the other. For a given time/longitude position, the 2-D function is rotated until the correlation is maximized. The function is stepped through all time/longitude positions (at 15 min./0.2° intervals). Sequences of contiguous "fits" define the coherent span, duration and propagation characteristics for each rain streak. The rainfall rate threshold to initiate a fit is 0.1 mm h-1 and a correlation coefficient of 0.3 is required for the fit to become part of the statistics. For the purpose of propagation statistics, the rectangular pulse is long (~12°) in order to have a stable measure of sustained movement of order 1000 km. For the purpose of span/duration statistics, this dimension is relatively short (~3°), consistent with the size of individual mesoscale convective systems, and also able to exceed the correlation threshold when centered close to the beginning and end of a rain streak. The cosine-weighting in both applications (Fig. 2) is matched to ~3 h rainfall duration at a given longitude, which is characteristic of the larger systems. Figure 2. Sample radar-rainrate Hovmoller diagram with autocorrelation fits superimposed (selected for clarity). A cosine-rectangular weighting function (illustrated in c)) is rotated in time-longitude space until it is maximized along the axes shown. a) autocorrelations for phase speed; b) autocorrelations for span and duration. Most major episodes continuously produce at least some detectable precipitation throughout the episode duration. However, some events exhibit intermittency while retaining full phase coherence. For example, if an eastward propagating squall line dissipates and its remnant cold pool/gust front initiates an MCS 100 km downstream, these systems, in effect, are classified as causally-related and statistically recorded as one long duration event (i.e., an episode). Such statistical determinations are made objectively by means of phase coherence autocorrelation and then manually checked for validity by inspection of animated composites of radar data in two spatial dimensions. Subjectively determined corrections, which take the form of disconnects and reconnects of precipitation entities, occur in approximately 2% of all cases. c. Echo-frequency Hovmoller diagrams of the diurnal cycleA set of averaged Hovmoller diagrams has been created to examine the phase-locked behavior of precipitation echo at diurnal and higher frequencies. Every radar echo above ~10 dBZe constitutes an "event" at a given longitude/time coordinate. The cumulative event frequency has been averaged for monthly and seasonal periods permitting the elucidation of regional, intra-seasonal and inter-seasonal variations. 3. Examples of Coherent Rainfall PatternIn this section we present a few examples of coherent rainfall patterns from the 1997-2000 period of record with emphasis on a qualitative depiction of intra-seasonal variations. The vehicle for this presentation is the radar-rainrate Hovmoller diagram, within which organized rainfall systems appear as time-longitude "streaks" of estimated rainfall rate. a. SpringThe effects of synoptic scale modulation are most pronounced in spring as illustrated in May 1999 (Fig. 3). The longitude interval is 115-78W and average rainfall rates are given in mm h-1. Sloping rain streaks are indicative of propagating rainfall regions somewhere within the latitudinal span of the domain (Fig. 1). The individual streaks represent the zonal component of motion (typically 10-25 m s-1). Streaks usually correspond to some form of organized convection such as a squall line or a MCS. Characteristic dimensions of the larger rain streaks are of order 1000 km and 20 h. Figure 3. Radar-rainrate Hovmoller diagram for the period (a) 1-15 May 1999, (b) 16-30 May 1999. Note the slow eastward propagation of precipitation "envelopes" in (a), within which there are faster propagating "rain streaks". The shaded, elliptical area denotes one such "envelope." In (b) there are mixed regimes including a more obvious component of diurnal modulation late in the period. The first half of May (Fig. 3a) exhibits well-defined longitudinal limits of rainfall activity on any given day. Between these limits, an "envelope" of activity is defined and this propagates eastward over a period of days at a relatively slow phase speed (~5 m s-1). One example of this is highlighted by an ellipse on Fig. 3 from 9-15 May. Such "envelopes" of rainfall activity are phase-coincident with baroclinic waves in the westerlies as determined from examination of National Centers for Environmental Prediction (NCEP) daily 2.5° analyses (e.g. Fig. 4). Phase-consistency with strong synoptic forcing is observed in springtime, however, the broader data set reveals significant insensitivity to transient synoptic disturbances in the westerlies. Figure 4. Hovmoller diagram of NCEP 2.5° data depicting anomalies of meridional wind for the period 1 through 9 May 1999, corresponding to most of Fig. 3a. The anomaly phase speed is essentially identical to the precipitation region. The second half of May 1999 (Fig. 3b) exhibits features more consistent with the broader data set. Successive days exhibit significant rainfall from the east slope of the continental divide (~105 W) to the eastern domain boundary. Longitudinal coherency and intermittency are also evident. In late May (e.g. 29-30), one begins to observe non-propagating horizontal structures across a broad longitudinal band, (~100 to 85 W). As will become evident from subsequent figures, these structures are associated with a diurnal maximum of "ordinary" convection, typically between 1800 and 0000 UTC. b. Transition to summerThe first week of June 1997 (Fig. 5a, upper) illustrates weakly-propagating and non-propagating convection across relatively narrow spans of longitude. Genesis zones are initially evident in the east and west and subsequently in the eastern Mississippi valley (90 W). Precipitation episodes propagate no more than 700 km during the first week of June 1997, a statistic quite uncharacteristic of the broader period of record. Figure 5. As in Figs. 3 for the period 31 May 1997 through 29 June 1997. See text for explanation. The remaining three weeks of June 1997 (Figs. 5a lower and 5b) are more broadly representative of the mid-summer condition in two aspects. Many rainfall streaks originate near 105 W (east slope of the continental divide) and some of these extend 1000 to 2000 km eastward. Propagation rates vary from 10 to 20 m s-1. Non-propagating diurnal convection, in phase with cumulative solar heating, is prominent in the last week of June. Strongly propagating convection occurs almost daily and coherency of the rain streaks is sometimes maintained from the Rockies to the Appalachians. Several amplifications and dissipations may occur along one continuous streak together with a smoothly varying phase speed (slope). For every continent-scale event of 20-40 h duration, there are numerous shorter streaks, broadly consistent with the lifecycle of MCSs (4-10 h). There are periods of 1 to 3 days duration circa 85W (e.g. 20-22 June) that are indicative of quasi-stationary forcing over orography in the southeastern United States. c. Mid-summerJuly 1998 is archetypal of the mid-summer condition (Figs. 6a, b). This period is often coincident in time with an active North American monsoon circulation, which is known for convection over the western cordillera and heavy rains in the desert southwest. Propagating convection occurs daily east of the continental divide. The major events span a sizeable fraction of the continent. Non-propagating convection can occur almost anywhere; is generally in phase with cumulative diurnal heating; and is the dominant mode of convection west of the continental divide. Westward-propagating convection occurs intermittently (e.g. 17-23 July) and is mainly associated with deep easterlies over the desert southwest. Variability in the pattern of precipitation is associated with the amount of convection west of 106 W; the suppression of propagating systems from 16 to 18 July; and the degree to which enhanced rainfall occurs over the eastern cordillera (e.g. 20-30 July). Figure 6. As in Figs. 3 for the period 30 June 1998 through 29 July 1998. See text for explanation. Perhaps the signal of greatest significance in Figs. 6 is the widespread distribution of convective activity and the dominance of diurnal forcing. This condition is consistent with low skill in the dynamical prediction of convective precipitation. Numerical weather predictions (via their data assimilation systems) are based on the dynamical foundation of quasi-balanced flow and synoptic scale forcing, the zonal variance of which may be secondary for extended periods in summer when thermal forcing can prevail. There is a propensity for nature to exploit widespread conditional instability over the continent in mid summer. In association with Figs. 6, we bring the reader’s attention to a class of westward-propagating events that can evolve from eastward-propagating systems with some regularity (e.g. 10-11, 15-16, 20-21 July). Westward propagation is slow (2 to 6 m s-1) and often associated with zonally oriented convective lines that have a simultaneous southward component of motion (see complete data set in Ahijevych et al. (2001) or the companion website). d. Transition to late summerThe first half of August 1998 (Fig. 7a) has several features in common with July including: non-propagating convection associated with cumulative diurnal heating; essentially non-propagating convection over the western cordillera; and coherent rain streaks east of the continental divide. However, two aspects of Fig. 7a differ significantly from July. Eastward-propagating structures are markedly less coherent and highly intermittent. Upon review of two-dimensional radar and satellite images, some of the intermittent streaks are subjectively judged to be causally related to each other (e.g. thin streaks in the 3-5 August period) whereas others provide no indication of a dynamical relationship (e.g. heavy streaks in the 12-14 August period).[1] From 2 to 11 August 1998, the strongest mid-summer synoptic modulation is observed. Figure 7. As in Figs. 3 for the period 30 July 1998 through 28 August 1998. See text for explanation. The second half of August 1998 (Fig. 7b) exhibits frequent convective events across the continent; however, these are both weaker and smaller in scale compared to the events in July. The diurnal signal, while evident, is not as well developed. Propagation distances, directions, and speeds, while highly variable, are relatively small. Transcontinental streaks, indicative of rapid propagation (30 m s-1), reappear for the first time since June (e.g. 24 August). e. Meridional distribution and propagationThe preceding charts have dealt exclusively with the longitudinal distribution of rainfall and the zonal component of motion. Propagation is less evident and spans shorter distances in the meridional dimension (Ahijevych et al., 2001). Figures 8a and b provide two examples of latitudinal rainfall distribution and motion over the same computational domain. The averaging of rainfall is performed in constant-latitude strips (115-75 W).[2] Figure 8. Radar-rainrate Hovmoller diagram, orthogonal to previous figures, in the meridional dimension. (a) for the period 15 - 29 June 1998; (b) for the period 15-29 July 1999. While numerous coherent streaks are evident, shorter distances and slower propagation speeds are indicated. Note the low frequency oscillation in (a) around 40 N where convection is most strongly forced. This pattern is much less evident in (b) where diurnal variability and equatorward propagation prevail. June 15-29 1998 (Fig. 8a) illustrates one common pattern where a slow oscillation of 7-10 days defines the preferred latitude band for strong convection. The convection is focused within latitude bands and generally does not propagate far to the north or south. Southward propagation (e.g. 19-20 June) is preferred by the heavier rainfall systems. Slowly varying latitudinal bands associated with quasi-stationary fronts are easily diagnosed by numerical prediction systems and the forecasts of heavy warm season rainfall often rely on the identification of strong forcing at fronts such as these. Figure 8b (15-29 July 1999) illustrates a less orderly and, perhaps, less predictable condition. There is a preferred latitudinal band for some of the heaviest rainfall events. However, in this case, convection is latitudinally widespread and rainfall systems occur in regions that are well removed from any preferred forcing zone. f. Two practical examples of complex coherencyFigure 9. Regional Hovmoller computational domain across southern tier of states. A leading-line, trailing stratiform mesoscale convective system is present at 0700 UTC, 27 May 1998. Figure 10. Radar-rainrate Hovmoller diagram for 27-29 May 1998 in the southern region. Note sudden changes in slope, coincident with (a) the MCS in Fig. 9; (b) precipitation associated with a convectively generated mesoscale convective vortex (MCV); (c) small squalls that are initiated within the MCV but rapidly propagate eastward from it. The 27-29 May 1998 episode (Fig. 9) originated under upslope flow in northern New Mexico together with dryline and cold pool initiations of convection in west Texas (~102-104W, 35-38N). Figure 9 shows a MCS over Texas at 0700 UTC on 27 May within a regional Hovmoller domain that extends from New Mexico to the panhandle of Florida (105 to 85 W, respectively). Figure 10 illustrates three phases of the episode. The first phase is associated with the leading-line/trailing-stratiform MCS depicted in Fig. 9, which propagated in a manner consistent with cold pool dynamics (e.g. Rotunno et al., 1988) at 17-19 m s-1. As the MCS dissipates, it spawns a mesoscale convective vortex (Trier, et al., 2000a). This vortex (centered at ~50-60 kPA) drifted slowly eastward with the 70 kPA winds (~4 m s-1) and was the principal forcing mechanism for regeneration of convection (Trier et al., 2000a) on 28 May. This period is marked by a steep slope in Fig. 10, when the rain streak phase speed was only 2-3 m s-1. The vortex dynamics and a stable nocturnal boundary layer (during most of this period) apparently prevented organization of convection into faster moving squalls. The mesoscale convective vortex weakened on 29 May and descended to the lower troposphere. On the southern and eastern flanks of the vortex, several small squall lines developed and propagated eastward at 14-18 m s-1. While the details of forcing and initiation are not well understood, causal relationships among these successive events are evident. The result is a continuum of rainfall events from New Mexico to the panhandle of Florida. Figure 11. Example of the "monsoon regime": Left column is sequence of enhanced IR GOES images over North America from (top) 1800 24 July 1998 through 1200 26 July 1998 (bottom). Center column is sequence of NOWrad™ images at the same times. Right column, matched in time to the GOES and radar images, is an expanded view of Fig. 6b for the period indicated. Note the consistent continent-scale coherent propagation. A second example of complex coherence is associated with the North American monsoon (Fig. 11); wherein southerly flow from Mexico transports low- and mid-level moisture over the western cordillera (e.g. Higgins et al., 1997). Exhibited are two days in the midst of such a period when rainfall episodes over the central continent had their origin over the east slope of the Rockies (cf. Fig. 6b). The left hand column shows GOES infrared imagery of North America and the center column shows the corresponding NOWradTM images. The coldest infrared cloud tops are dark blue and purple, nominally corresponding to tropopause heights. Cold cloud tops proliferate over the western cordillera at approximately 00 UTC on each day in response to cumulative diurnal heating. What follows is the eastward and southeastward propagation of one (or more) cold cloud shields across the continent during nocturnal hours. The convective systems underlying these cloud shields evolve into less erect forms of convection and persist into the following day. The Hovmoller representation of these events is depicted in the right hand column, where the (vertical) center of each GOES and radar image is at the time shown on the Hovmoller diagram to its right. The evolution of propagating cold cloud tops shows evidence of dissipation and regeneration of convection over the two-day lifecycle of these episodes. 4. Periodicity of rainfallWe employ two methods to examine the periodicity and phase of rainfall. The first method examines coherent structures associated with average radar echo-frequency within the diurnal cycle. Hovmoller diagrams of radar echo-frequency are averaged over months, seasons, and the entire period of record. The second method performs discrete Fourier Transforms (DFTs) along the time dimension of echo-frequency diagrams to isolate signals in the power spectra that are associated with diurnal and shorter periods of oscillation. A complete set of echo frequency diagrams and DFT analyses are found on our website and in Ahijevych et al. (2001). a. Echo frequency diagramsWe have counted the fraction of time that radar echo is present at each longitude-time coordinate with 0.2° and 1.0 h resolutions. Coherent patterns of average echo frequency in this coordinate system can represent a "phase-locked" occurrence of rainfall events. For example, diurnally modulated convection over fixed heat sources (such as mountains) would fit the phase-locked description in a local sense. Furthermore, if such convection consistently propagates from the fixed source region in a preferred direction and at a preferred speed, then it may be referred to as phase-locked in a global sense. Our focus herein is on the global aspects of phase-locked behavior and also to further quantify the effects of diurnal and semi-diurnal forcings. Figure 12. Diurnal echo-frequency Hovmoller diagram for the entire period of record (1997-2000). The diurnal cycle is repeated twice for clarity across the UTC day boundary. The scale corresponds to the percentage of days during which precipitation echo is present at the given longitude-UTC hour coordinate. Four principal signals are evident including: the diurnal oscillation, propagation from the western cordillera, a semi-diurnal signal between the cordilleras (dashed lines), and suppression of the in-phase diurnal maximum near 98-99 W (white arrow). Figure 12, an average of warm seasons 1997-2000, illustrates the diurnal cycle in a "back-to-back" format, meaning the same data are repeated along the time axis to capture features that span more than one UTC day. A value of 60 means that radar echo is detected at that coordinate (longitude, UTC-hour) on ~60% of all days. Several features are plainly evident in this echo climatology:
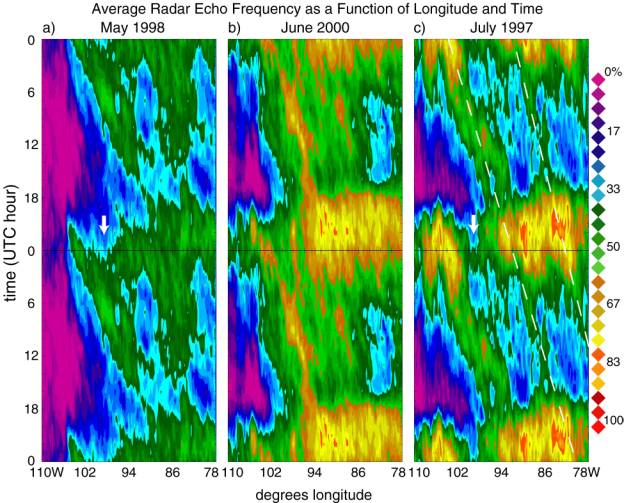
The diurnal maximum between 2000 UTC and 0100 UTC is plainly evident across the continent except near longitude 98-99 W where it is suppressed (Fig. 12, white arrow). The most frequent "origin" of rainfall in the west is at 105.5 W (circa 2100 UTC), which coincides with the eastern most position of the continental divide (40 N). Thermal forcing over the Rockies, when combined with deep westerly shear, favors a solenoidal circulation to the east of the mountains (e.g. Wallace, 1975; Dai et al., 1999). The daytime upward branch over the mountains and high plains is mass-compensated, primarily by a descending branch to the east. This regional condition suppresses a substantial fraction of afternoon convection circa 98-99 W, especially during the period of the North American monsoon (Higgins et al., 1997). The implied rate of propagation between 105 W and 94 W is 16 m s-1, considerably faster than typical "steering level" winds (e.g. 70 kPa). Despite the very high frequency of "echo origination" near 106 W, this meridian has the lowest average daily frequency of echo over the continent (east of 109 W). The low average frequency is the result of near-zero activity throughout most of the diurnal cycle. One effect of eastward propagation from the western cordillera is to produce a delayed-phase diurnal signal that spans the nocturnal-to-sunrise period (0800 - 1200) eastward to 96 W. Circa 98 W, this delayed-phase diurnal signal creates (computationally) a very strong semi-diurnal signal. Eastward from 96 W, a "pure" semi-diurnal signal at 1100 UTC is evident (Fig. 12, dashed line). Rainfall associated with this semi-diurnal signal is often non-propagating. East of 82 W there is an abrupt decrease in radar echo frequency. This attribute of Fig. 12 is an artifact of the eastern United States geography (Fig. 1). East of 82 W, radar coverage is absent both over Canada in the north of our domain and over the Atlantic Ocean in the southern portion. While area-normalization procedures could mitigate this artifact, the effect of such a correction could be highly disproportionate within each season and among them, so we elect not to make a corrective calculation of this type. Figure 13. Same as Fig. 12 but for (a) May 1998, (b) June 2000, (c) July 1997. In July 1997, the absolute maxima are near 90% at 83 and 90 W, circa 2200 UTC. White arrows in a) and c) highlight suppression of the in-phase diurnal maximum near 98-99 W. Diagonal dashed phase-lines in c) highlight day-2 and day-3 phase-locked propagation. See text for description of intra-seasonal variations. Figure 13 shows examples of intra-seasonal variability from May through July. We have selected three months from the period of record that best illustrate the major features associated with this variability, however, we encourage the reader to examine the entire record (Ahijevych et al., 2001) owing to inter-seasonal variations presumed to be associated with differences in large-scale forcing. May 1998 (Fig. 13a) shows a diminished diurnal amplitude compared to the seasonal average and the suppression of an in-phase diurnal maximum circa 98 W (white arrow). Propagation from the western cordillera is evident, as are the nocturnal/morning maxima in the inter-cordillera region. There is a weak suggestion of phase-locked propagation east of 92 W. June 2000 (Fig. 13b) retains similar major features with a greatly strengthened diurnal signal and more activity overall. An important difference between May and June is evidence supporting a phase-locked day-2 propagation, located ~10° east of the day-1 echo frequency maximum (e.g. 88W, 1200). July 1997 (Fig. 13c) shows further evidence for day-2 and day-3 propagation as indicated by the diagonal white lines, which overlay the frequency maxima. Given the trans-continental rain streak patterns exhibited in section 3, evidence of multi-day propagation is not surprising. However, we note the remarkable degree of phase-locking required to produce the pattern observed in Fig. 13c over a monthly average. Furthermore, such phase-locked behavior is suggested in somewhat "blurred" form, for some four-season monthly averages, and entire warm seasons (Ahijevych et al., 2001). Reference to Fig. 12 reveals that the secondary semi-diurnal maximum (1100, 86 W) is coincident with the day-2 propagation signal. The implied rate of propagation east of the Mississippi River is less than in the western US (typically 9 to 13 m s-1). b. Harmonic decompositionWe performed one-dimensional DFTs on the averaged diurnal timeseries represented by Fig. 12. This eliminates all spectral energy below the diurnal frequency and allows for a greater sensitivity to spectral maxima at frequencies higher than diurnal. The resulting power spectra (Fig. 14a) contain three strong signals:
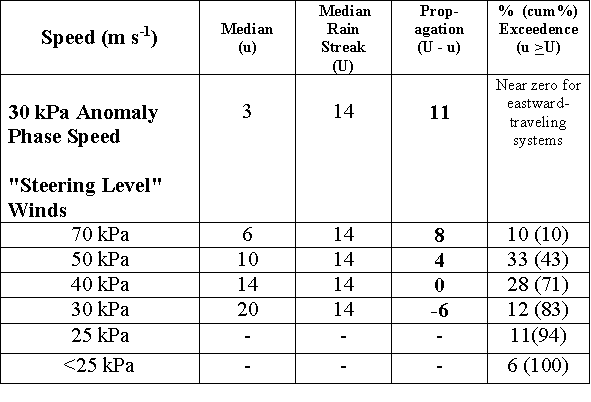
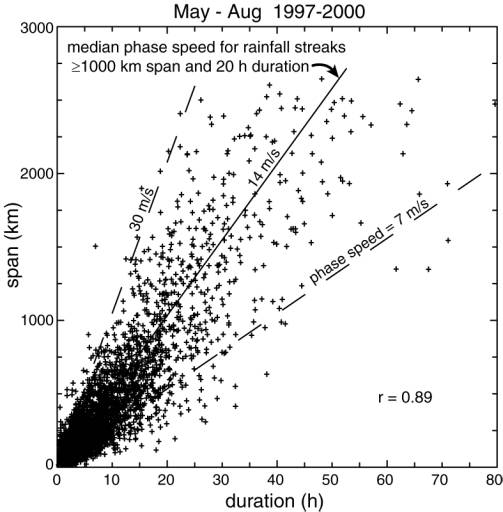
The simplicity and symmetry of this result is surprising. We find it to be fully consistent with the diagrams previously presented herein and the historical literature regarding thermal forcing in the presence of elevated and sloping terrain, and the diurnal frictional variation. The diurnal maxima exhibit somewhat different relationships to their respective cordilleras. The western maximum stretches eastward over sloping terrain, consistent with the observed propagation. The eastern maximum sits squarely over the highest terrain, consistent with less eastward propagation. The semi-diurnal maximum (94 W) is very strong and it is located precisely at the eastern terminus of sloping terrain. This longitude is also coincident with the eastern edge of the low-level jet climatological zone (Bonner, 1968). Figure 14. Power spectrum, (a), and harmonic decomposition (b), (c), (d), of Fig. 13. The power spectral density vs. longitude, (a), exhibits three signals; diurnal oscillation over and near the eastern and western cordilleras, and semi-diurnal oscillation between the cordillera. The harmonic decompositions quantify the relative amplitudes of diurnal and semi-diurnal oscillations in three longitude bands (b) west, (c) central, (d) east. Thick, solid curve is echo frequency; long-dashed is the 1st harmonic; short-dashed is the 2nd harmonic. Figures 14 b-d quantify the phase and amplitude of the diurnal and semi-diurnal signals by illustrating a least squares harmonic decomposition[3] in three meridional bands (west, 110-102 W; central, 98-90 W; and east, 86-78 W). These figures quantify the exceptionally large diurnal amplitude in the west (Fig. 14b); the dominance of semi-diurnality in the central region (Fig. 14c); and an intermediate condition in the east (Fig. 14d). In the west the semi-diurnal amplitude is ~ 25% of the diurnal. It is associated with slow decline of echo frequency in the nocturnal hours compared to the rapid rise of echo frequency in daytime, a pattern that mimics low cooling rates associated with outgoing long-wave radiation and rapid warming associated with incoming short-wave radiation. We cannot detect any semi-diurnal regeneration of rainfall in the west. In contrast, the amplitude of semi-diurnal oscillation in the central region (Fig. 14c) is ~200% that of diurnal, however, the total amplitude of variation is small. The east (Fig. 14d) is intermediate in all aspects with a semi-diurnal signal that is ~40% of the diurnal. The semi-diurnal phase is fairly uniform at all meridians with maxima near 1100 and 2300 UTC. The diurnal maxima occur near 0100 UTC at the west and central meridians and near 2300 UTC in the east. 5. Rain Streaks and Related StatisticsWe have presented evidence to support the notion that rain streaks are mainly diurnal in frequency, have large scale coherence in the zonal dimension and, to a limited extent, exhibit phase-locked behavior. Here we attempt to quantify the coherence and phase speed aspects by means of two-dimensional autocorrelation analyses described in section 2b and supporting analyses from the NCEP 2.5° data. We have examined both zonal-span and duration properties from 5406 rain streaks over 492 warm season days, or approximately 11 per day. In addition, we have calculated the zonal phase speeds and compared these to both the zonal phase speed of upper tropospheric anomalies and the zonal "steering-level" winds. Our statistics represent only the zonal component of motion, U, which is defined by U = S cos a, where S is total phase speed and a is the angle of departure from zonal motion. Accordingly, conclusions with respect to propagation rate (and span) are drawn from comparison with other data where only the zonal component is considered. a. Span-duration statisticsThe cumulative probability density distribution (CPD) for rain streak span, as defined in section 2b, is logarithmically linear in form (Ahijevych et al., 2001) to a distance of ~ 2500 km. Span statistics are relatively invariant over the four-season period. The CPD may be approximated by a power law of the form N(S) = N0 10-LS (1) where N(S) is the number of rain streaks of span > S (km), N0 is the total number of streaks, and L = 10-3 km-1. The CPD for rain streak duration is also logarithmically linear out to 65 h and it may be approximated by N(D) = N0 10-GD (2) where D is duration (h) and G = 0.05 h-1. It can be shown from (1) and (2) that a phase speed, U = S/D = G/L ~14 m/s, is implied through the use of these expressions. The median streak duration is 4.5 h, which is characteristic of ordinary mesoscale convective systems. At 11 h duration (an average MCC lifetime), the rain streak frequency is more than five times that reported for MCCs by Augustine and Howard (1991). Span and duration statistics are collectively summarized in Table 1. We employ "recurrence frequency" as a means to express the frequency of the "longest" 10% of all episodes. Recurrence frequency is defined as the average interval of time for recurrence of an event that equals or exceeds a specified span or duration. At the recurrence frequency of once per day, there are events of > 838 km span and > 18.5 h duration, thereby exceeding, by a considerable margin, the average characteristics of individual convective systems. To achieve this daily recurrence frequency (as evinced, for example, by Fig. 6), "long" events must occur on most days, portions of which are likely under synoptic conditions less favorable than the mean. At the weekly recurrence frequency, the coherency characteristics extend to 2000 km and 40 h. We find these results to be surprising, especially since the "long" events are most frequent in mid-summer, under conditions that are customarily described as "weakly forced." An inevitable conclusion is that large portions of the continent routinely harbor conditions that are, in some sense, favorable to (or cannot suppress) the initiation, maintenance or transit of deep convection. We speculate that much of the observed warm season rainfall results from strong thermal forcing combined with as yet unidentified mechanisms underlying convective system propagation. Convective system propagation is a straightforward means to overcome inhibition (negative CAPE) to convection where local forcing may be insufficient. For example, forced lifting in the planetary boundary layer is a common mode of convective initiation (Wilson and Schreiber, 1986) and regeneration. b. Zonal phase speedPhase speed characteristics of rain streaks are of particular interest because these offer the opportunity to diagnose dynamical organizations that underlie the structures. We have examined the span/duration CPD statistics for phase speed inferences and we have compared these to the slopes of the autocorrelation data. More than 27,000 phase speeds were estimated on > 5400 rain streaks in the manner described in section 2b. Approximately 4-6% of rain streaks exhibit slow westward motion (U < 0). Such events are mainly confined to the desert SW and the Gulf of Mexico coast in mid-late summer. For the purpose of median zonal phase speed estimation, we restrict our analyses to eastward-traveling systems. Figure 15. Rain streak span vs. duration data. Solid curve shows the median phase speed (14.3 m s-1) for events > 1000 km and 20 h. Dashed curves locate the 30 m s-1 (upper) and 7 m s-1 (lower) phase speeds, inclusive of most "long" events. A correlation coefficient of 0.89 is indicated. The span/duration statistics from Table 1 also provide strong inferences of zonal phase speed, though the meaning of these is slightly confounded by details of the autocovariance function. Figure 15 shows the bivariate distribution (a correlation coefficient of 0.89) and a phase speed line at 14.3 m s-1 corresponding to the median zonal speed for rain streaks > 1000 km and 20 h duration. Most of the events in Fig. 15 are bracketed by 30 and 7 m s-1 zonal phase speed lines. Table 2. summarizes three additional sets of zonal phase speed estimates, stratified according to recurrence frequency. The top row within each recurrence frequency is simply the speed implied by each span/duration couplet in Table 1. The bottom row within each recurrence frequency is the median span/duration ratio (at the relevant scale of event) calculated from the data in Fig. 15. The central row is an "exceedence speed", defined as the average zonal phase speed that is equaled or exceeded for each recurrence frequency. For example, during the 492 day period of record, approximately 492 rain streaks equaled or exceeded the phase speed of 23.9 m s-1 (an average of 1 per day). "Long" events (frequency of 1 to a few per week) exhibit slightly larger mean phase speeds, however, the extrema of central measures over the period of record maintain a relatively narrow range, from ~12 to 18 m s-1. Zonal phase speed differences between seasons appear to be systematic and may be related to mean zonal wind variations. For the purpose of defining a global central measure of the zonal speed component, 14 m s-1 appears to be robust with respect to these various calculations. c. Propagation implicationsWe have examined the 1998 and 1999 NCEP 2.5° data in latitude bands corresponding to the largest convective events. We have compiled seasonal statistics on 30 kPa anomaly phase speeds and zonal "steering" winds at 70, 50, 40, 30, and 25 kPa. The various zonal speed estimates were then examined with respect to their propagation implications. Our principal measure of upper tropospheric zonal phase speed was derived from Hovmoller diagrams of meridional wind anomalies (from climatology) at 30 kPa (e.g. Fig. 4). This variable almost always revealed a phase speed signal associated with traveling disturbances in the westerlies. On those occasions when this failed, other fields (e.g., geopotential height, temperature) were inspected and sometimes led to an improved definition of zonal phase speed. The median zonal phase speeds were determined simply by inspection of Hovmoller diagrams of the NCEP data (e.g. Fig. 4) for the 35 N - 42.5 N latitude band. Naturally occurring phase speed changes at 3 to 7 day intervals led to the estimation of 45 values in 34 weeks. The variance of median phase speeds was calculated and extreme values were recorded for scales characteristic of the major rain streaks (~ 1 day, 5° longitude). The combined 1998-1999 statistics were quite stable and exhibited consistency. The means of the median values for each season were 2.6 and 3.3 m s-1 for 1998 and 1999, respectively. The standard deviation was 3 m s-1 for both years. The extrema in both seasons were -2 and 10 m s-1. On average, transient disturbances can effectively extend the zonal "envelope" of convective rain streaks by ~20% during the course of a 14 m s-1 (phase speed) event because these typically propagate eastward at ~20% of the rain streak speed. The phase speeds indicated by the NCEP 2.5° data are quite slow in comparison to commonly held perceptions of upper-tropospheric short-wave speeds. The 2.5° analyses include a spectral low-pass filter at T36 thereby damping structures below ~ 1000 km, which probably suppresses evidence of most short-waves. It should be noted the group velocities in the westerlies could account for much faster propagation of atmospheric phenomena, however, group velocity structure was not evident in the NCEP data throughout most of the warm seasons examined. "Steering Level" is defined as the lowest standard pressure altitude at which median zonal wind speed, u, equals or exceeds the locally-averaged rain streak phase speed (U) within a 7-day x 5° (longitude) domain. Median zonal steering winds were calculated from the NCEP data at a 1-week and 5° longitude interval in the 35°-42.5° N latitude band. Since organized convection is known to occur with greater frequency just southward of stronger winds in the upper troposphere (Laing and Fritsch, 2000), our samples included some winds from 30-35 N or 42.5-47.5 N latitude bands, as appropriate, if large convective systems were located far to the north or south. In any given instance there will exist a spectrum of winds and rain streak phase speeds, however, the 7-day x 5° aggregation of data is sufficient to capture gradients associated with most of the major changes while retaining a moderate degree of stationarity within each 7-day x 5° bin. Notably, we could not detect a statistically significant correlation between the steering level and tropospheric wind speeds. For example, the probability density histogram of steering levels during the highest wind period (circa 1 June 1998) was statistically indistinguishable from a period in August with minimum winds. To the extent that standard pressure level data permit such discrimination, it appears that steering level is approximately conserved. Table 3 summarizes the various rain streak, anomaly, and steering level wind speed information, with an eye toward inferences about propagation. The upper tropospheric phase speeds are only ~20% of rain streak phase speeds, therefore strong relative propagation is indicated. Our attention is drawn to steering level winds and the fraction of time these equal or exceed rain streak phase speeds. Table 3 shows that lower tropospheric steering (U=u) rarely occurs at 70 kPa, and most frequently occurs at or above 50 kPa. The median steering level is approximately 40 kPa and 29% of events have a steering level above 30 kPa. No steering level is indicated for 6% of events. These results are suggestive of one or more wave-like propagation mechanisms that act in superposition with the steering winds. 6. Discussion and Conclusionsa. Principal findingsWe have presented a litany of statistics without much comment on the underlying physical and dynamical processes. The statistics support the following conclusions:
b. DiscussionAdequate representation of convection is generally regarded as an unsolved problem in numerical weather and climate prediction. Applications as diverse as short-range prediction of precipitation and fundamental water cycle issues are dependent upon appropriate representations of warm season rainfall processes in forecast models at all timescales. Our findings contain inferences of predictability, by reason of precipitation coherence patterns, that exceed the dimensions of convective system lifecycles. The coherence properties do not appear to be "tightly held" by transient disturbances in the westerlies that precede (i.e. have existed upstream of) the occurrence of convection over the western cordillera. We hypothesize that the principal significance of this study has its roots in lower boundary forcing, dynamics at the mesoscale, and the capacity of organized convective effects to scale upwards and to act remotely. One example of "remote action" could be the creation of upper tropospheric potential vorticity anomalies by convection over the Rockies that subsequently advect eastward with the upper tropospheric winds. The statistics establish a prima facie case for dynamical linkages among successive convective systems. The linkages exhibit phase coherence with respect to antecedent convective systems that are often forced diurnally. Because rain streaks are often not located optimally with respect to large scale forcing, there is presumed to be a causal "upscale" or "downstream" effect resulting from the antecedent convection. Judging from the amplifications and dissipations along many rain streaks, several generations of organized convection may be causally related in this manner. Convective precipitation lifecycles are poorly represented in today's weather and climate forecast models. It would seem advisable to communicate such forcings to the grid scale to permit the propagation of convection and the attendant rainfall. For example, we have illustrated precipitation patterns that are suggestive of a "remote response" to the North American monsoon condition, linking precipitation systems over central and eastern North America to the western cordillera. The challenge is to understand these dynamical linkages as a necessary step toward proper representation. What candidate mechanisms exist? We offer a statistical result consistent with wave-like propagation. At least two broad categories are evident:
There is ample evidence for the excitation of secondary convection from convectively-generated boundary layer disturbances of both the gravity current and gravity wave types (e.g. Purdom, 1982; Doviak and Ge, 1984; Wilson and Schreiber, 1986; Mueller and Carbone, 1987; Carbone et al., 1990; Crook et al., 1990; Koch et al., 1991; Carbone et al., 2000; Wilson et al., 2001). Carbone et al. (1990) established linkages among three successive mesoscale systems over one diurnal cycle and approximately 1000 km distance, including both the gravity current and undular bore mechanisms. If one attempts to employ approximate calculations of propagation speed as a means to identify dominant mechanisms of MCS maintenance and regeneration, such efforts are thwarted by results that are all too uncertain and inclusive. Density current speed, V, is approximated by V2 = k2gh(Dr/r), where k is of order unity, g is gravitational acceleration, h is the current depth and r is ambient air density. This leads to a plausible range of results (10 to 22 m s-1) for commonly observed (buoyancy -1 to -5 %, 1 km deep) cold pools. Observations and calculations of trapped gravity wave phase speeds are similarly plausible. Koch et al. (1991, Table 1), have summarized numerous observed cases over the U.S. that propagate from 13 to 24 m s-1. Shallow-water equation approximations under constant stratification and no shear also yield plausible results (10 to 40 m s-1) for observed nocturnal boundary layer conditions (N= 0.01 to 0.02 s-1, h = 1 km) where N is the Brunt-Vaisala frequency. More realistic calculations in shear and/or non-constant stratification yield differing results but span a similar dynamic range (Crook, 1988; Raymond and Rotunno, 1989). Are planetary boundary layer disturbances the "connecting tissue" among successive convective events that span and duration statistics suggest? Long-lived density current propagation in neutral (daytime) boundary layers followed by trapped gravity waves in the stable nocturnal boundary layer offer a plausible continuum. However, these mechanisms are either inherently dissipative or dispersive and conditions may often be unfavorable for the generation or maintenance of either. Convective gravity wave excitation and maintenance by the ensemble of latent heating in the free troposphere has considerable appeal in its application to propagating episodes, as evidenced by the sizeable body of literature associated with the concept. These studies (e.g. Moncrieff and Miller, 1976; Raymond, 1984, 1986; Tripoli and Cotton, 1989) are theoretical for the most part. Attempts to verify the concepts have been modest, mainly because verification based on observations is costly and logistically difficult. The efforts so far have generally met with inconclusive or negative results, so a more vigorous exploration of this issue is required in light of the findings herein. Our calculations substantiate the plausibility for wave-like propagation under sub-tropical conditions as described by the idealized findings of Moncrieff and Miller (1976). Their steady state model, when applied to an atmosphere with deep shear of low magnitude, predicts that squall-type convection will propagate (with respect to mid-level winds) c = ~0.3 (CAPE)1/2, where c is in m s-1 and CAPE in J kg-1. If we accept the propagation value of 8 m s-1, deduced from the 70 kPa winds in Table 3, the inverse calculation implies a characteristic CAPE of ~700 J kg-1. This is a plausible value when averaged over the lifecycle of long-lived systems. Koch and O’Handley (1997) have provided relevant information about typical steering levels for mesoscale gravity waves associated with unbalanced flow at the synoptic scale. The mean height of the observed critical levels was 467 hPa, broadly consistent with the propagation statistics herein. Another category of coherent regeneration is convective forcing of quasi-balanced mesoscale circulations that either retain a capacity to maintain organized convection (Raymond and Jiang, 1990) or later gain the capacity to regenerate it. A circulation that fits this description is the mesoscale convectively-generated vortex (MCV), a well known by-product of some mesoscale convective systems (e.g. Bartels and Maddox, 1991; Fritsch et al., 1994; Weisman, 1993). Recently Trier et al. (2000a) and Davis et al. (2001) have established that there exists a greater number of MCVs than previously documented. How frequently are MCVs associated with significant regeneration of convection and to what extent are these related to the "long" episodes herein? MCVs are sometimes associated with non-propagating episodes (e.g. section 3c) and, therefore, might not contribute strongly to the statistics associated with propagating events. Both weather and climate prediction are heavily dependent upon an adequate representation of convective precipitation processes. A speculative conclusion of this study is that probabilistic precipitation forecasts of 6 to 48 h range might be substantially improved through the combined use of dynamical and statistical methods. Antecedent convection and its observed propagation routinely place narrow bounds on the future meridional position of heavy precipitation episodes, up to 48 h range. Dynamical forecast models routinely identify the latitudinal bands of mesoscale ascent and the associated production of thermodynamic instability (e.g. Laing and Fritsch, 2000). The combined strengths of meridional prediction by means of statistical expectation and latitudinal prediction by means of numerical forecast models may prove to markedly increase skill in warm season rainfall forecasts at the short-range. AcknowledgementsThis research was sponsored by National Science Foundation support to the U.S. Weather Research Program. The authors are deeply appreciative for assistance received from the National Climatic Data Center, the website of NOAA/CIRES Climate Diagnostics Center at U. of Colorado, S. Goodman of NASA’s Marshall Spaceflight Center, NOAA/CIRA at Colorado State University, NOAA/NESDIS, and our sister organizations at NCAR/UCAR, namely the Resarch Applications Program and COMET. These organizations provided critical access to datasets, without which this study would have been impossible. We are also appreciative of helpful suggestions and information provided by C. Davis, K. Emanuel, T. Hollingsworth, E. Kalnay, M. Moncrieff, R. Rotunno, G. White and two anonymous reviewers. References
Table 1. Rain Streak Zonal Span and Duration
Table 2. Rain Streak Zonal Phase Speeds
Table 3. Rain Streak Zonal Propagation (m s-1)
* NCAR is sponsored by the National Science Foundation [1] The criteria for determining "apparent causality" are imprecise and subject to uncertainty. In two spatial dimensions we examine movie loops of radar data and often see boundary layer echoes, likely associated with propagating cold pools, that connect successive precipitating convective events on a constant phase-speed line. Determinations such as this affect ~2% of data entering the statistics. [2] For a complete set of meridional diagrams the reader is referred to our website or Ahijevych et al.(2001). [3] A least squares fit is sequentially performed for the zeroth (mean), 1st (diurnal), and 2nd (semi-diurnal) harmonics. These harmonics explain > 90% of the variance observed within the longitude bands. |
| NCAR is sponsored by the National Science Foundation | ||