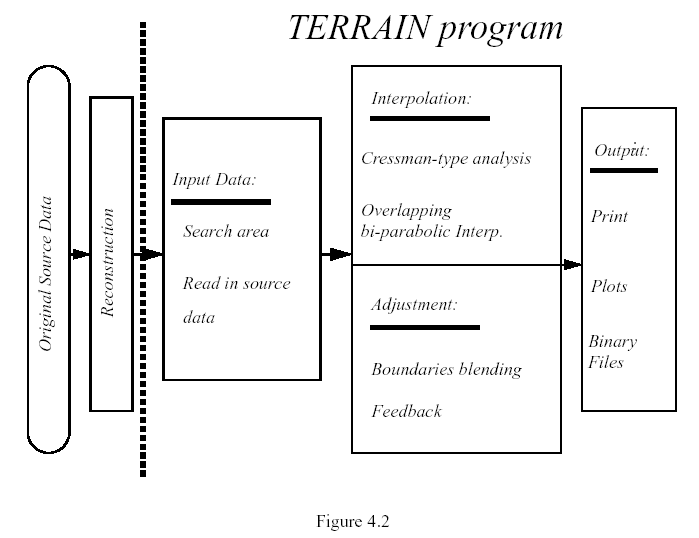
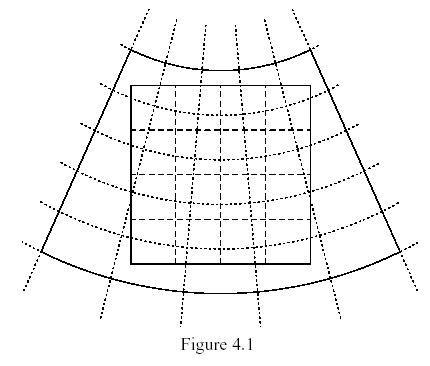
The program that begins any complete forecast simulation in MM5 modeling system is TERRAIN (Fig. 1.1). This program horizontally interpolates (or analyzes) the regular latitude - longitude terrain elevation, and vegetation (land use) onto the chosen mesoscale domains (see Fig. 4.1). If the land-surface model (LSM) will be used in the MM5 model, additional fields such as soil types, vegetation fraction, and annual deep soil temperature will also be generated.
There are essentially two tasks the program TERRAIN performs:
1. Set up mesoscale domains: coarse and fine grids (except for moving nests);
2. Produce terrestrial data fields for all of the mesoscale domains, which will first be used by REGRID, and later by MM5 (optionally) and NESTDOWN. The program also computes a few constant fields required by the modeling system: latitude and longitude, map scale factors, and Coriolis parameter.
The data available as input to the program TERRAIN include terrain elevation, landuse/vegetation, land-water mask, soil types, vegetation fraction and deep soil temperature. Most data are available at six resolutions: 1 degree, 30, 10, 5 and 2 minutes, and 30 seconds. Here is the list of available data:
1. Elevation data at six resolutions from USGS: 1-degree, 30-, 10-, 5-, 2-minutes (5 files) and 30-second (33 tiles directly from USGS). All lower resolution data (1 degree to 2 minutes) are created from the 30 seconds USGS data.
2. Three types of source vegetation/land-use data available:
(a) 13-category, global coverage with the resolution of 1-degree, 30- and 10-minute (3 files);
(b) 17-category, North-American coverage with the resolution of 1-degree, 30-, 10-, 5-, 2-minutes and 30 seconds (6 files);
(c) 25-category, global coverage with the resolution of 1-degree, 30-, 10-, 5-, 2-minutes and 30-seconds (6 files; all lower resolution data are created from 30 sec data from USGS version 2 land cover data).
3. Two types of land-water mask data:
(a) 17-category, North-American coverage with the resolution of 1-degree, 30-, 10-, 5-, 2-minutes and 30seconds (6 files);
(b) 25-category, global coverage with the resolution of 1-degree, 30-, 10-, 5-, 2-minutes and 30-seconds (6 files).
4. For LSM option in MM5, the soil, vegetation fraction, and annual deep soil temperature are needed. The source data files are:
(a) 17-category, six resolutions of global soil data (6 files);
(b) 12 monthly, 10-minute, global vegetation fraction data (1 file);
(c) 1-degree, global annual deep soil temperature (1 file).
Since the original data come from different sources, they have different formats and layouts. These data sets are translated to a standard format which is used by the TERRAIN program. The data arrangement and format in the reformatted data file are as follows,
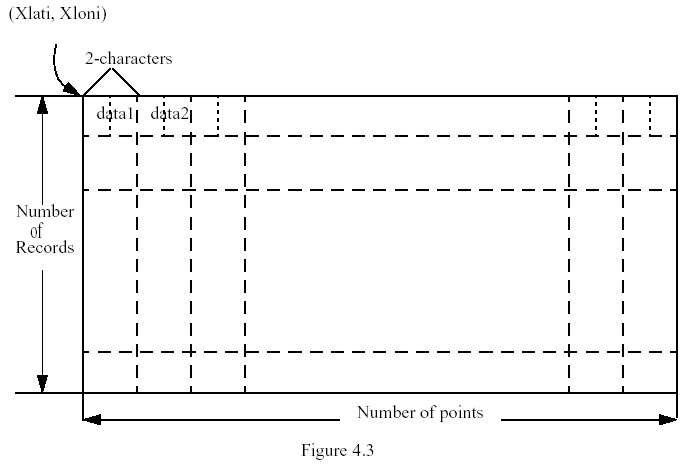
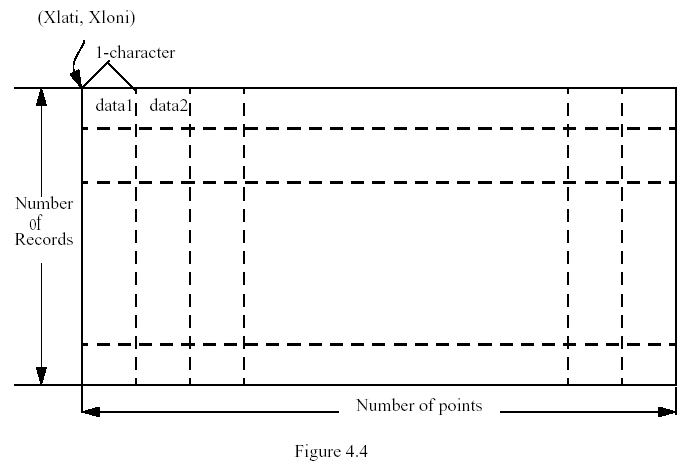
Table 4.1b PSU/NCAR Land-use Data
The 13 categories are listed in Table 4.2a. The data are represented by 13 numbers of percentages for the 13 categories at each of lat/lon grid points.
Table 4.1c 17-category SiB Vegetation Data
The 17 categories are listed in Table 4.2b. The 30-sec data are represented by one category-ID number at each of lat/lon grid point. The low resolution (1-deg, 30-, 10-, 5- and 2-min) data are derived from 30-sec data, and are represented by 17 numbers of percentages for the 17 categories at each of lat/lon grid points.
Table 4.1d 25-category USGS Vegetation Data
The 25 categories are listed in Table 4.2c. The 30-sec data are represented by one category-ID number at each of lat/lon grid point. The low resolution (1-deg, 30-, 10-, 5- and 2-min) data are derived from 30-sec data, and are represented by 25 numbers of percentages for the 25 categories at each of lat/lon grid points.
(1) North-American Land-water mask files derived from SiB Vegetation data
Table 4.1e SiB Land-Water Mask Data
The SiB land-water mask data files are derived from SiB vegetation data files. At each of lat/lon grid points, there is one number indicating the land ( 1), water ( 0), or missing data (-1) at that point.
(2) Global Land-water mask files derived from USGS Vegetation data
Table 4.1f USGS Land-Water Mask Data
The land-water mask data files are derived from USGS vegetation data files. At each of lat/lon grid points, there is one number indicating the land ( 1), water ( 0), or missing data (-1) at that point.
Table 4.1g Global 17-category Soil Data
The 17-Category Global Soil data files are generated by
(1) Global 5-minutes United Nation FAO soil data are convert to the 17 categories same as STATSGO data (available since V3.5);
(2) North-American STATSGO 30-sec soil data
(3) Global high resolution soil data are produced from 5-min FAO data;
(4) North-American low resolution (1-deg, 30-, 10-, 5 -and 2-min) soil data are derived from the 30-sec North-American soil data;
(5) FAO and STATSGO data are merged together for each of the resolutions.
(6) Both top soil layer (0 - 30 cm) and bottom soil layer (30 - 100 cm) data are provided. Obtaining a particular dataset can be set in terrain.deck.
The 17 categories are listed in Table 4.2d. Similar to the vegetation data, the 30-sec data are represented by one category-ID number at each of lat/lon grid point, and the low resolution (1-deg, 30-, 10-, 5- and 2-min) data are represented by 17 numbers of percentages for the 17 categories at each of lat/lon grid points.
Table 4.1h Global Monthly Vegetation Fraction Data
The 10-min original vegetation fraction data contained 12 percentage-values for 12 months at each of lat/lon grid points, but covered only from 55oS to 75oN. To make the data file have global coverage, a zero value of vegetation fraction was assigned over the high latitude area.
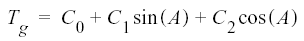
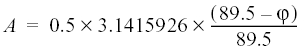
Table 4.1i Global Annual Deep Soil Temperature Data
The resolution of the 1-deg annual deep soil temperature data is rather low. For some of grid points located at small islands in the ocean, it is unable to obtain the deep soil temperature value by interpolation based on this source dataset. In this case, an annual deep soil temperature, Tg, will be assigned based on the latitude of the point, j:
If a user has a different source data, the data must be translated to the above standard format and a direct-access file. In addition, the following information should be provided to the TERRAIN program through a DATA statement in setup.F or in vs_data.incl, and paramesv.incl.
Note: (1) If your own data contain missing data, you must provide the missing-value and modify the interpolation subroutine INTERP or ANAL2 for processing missing-values.
(2) For plotting the map of vegetation and soil, one may need to modify the existing color tables, especially if the number of categories have been changed.
Table 4.2a Description of 13-category (PSU/NCAR) land-use categories and physical parameters for N.H. summer (15 April - 15 October) and winter (15 October - 15 April).
Table 4.2b Description of 17-category (SiB) vegetation categories and physical parameters for N.H. summer (15 April - 15 October) and winter (15 October - 15 April).
Table 4.2c Description of 25-category (USGS) vegetation categories and physical parameters for N.H. summer (15 April - 15 October) and winter (15 October - 15 April).
Table 4.2d Description of 17-category Soil categories and physical parameters
There are a number of key parameters a user must specify in order to define mesoscale domains. These are:
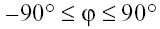
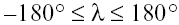
The latitudes and longitudes of mesoscale grids should be in the range of
 |
(4.1) |
 |
(4.2) |
There are some restrictions in defining a nest in the program:
- A nest domain must start and end at a coarse domain grid point whether it is a one-way or two-way nest. This means that for a two-way nest, the number of grid points in the nest must satisfy (number of nest grid points - 1)/3 is an integer.
- A nest must be at least 5 coarse grid points away from the coarse domain boundary. This is necessary to ensure enough data points are available when it comes to nest interface adjustment (see below).
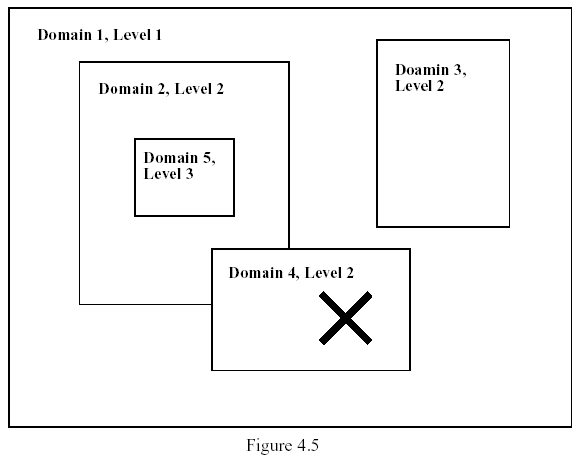
- TERRAIN program cannot be used to generate overlapping nests. Overlapping nests, and moving nests can only be dealt with in the MM5 model, which interpolates from the coarse domain data (see Fig. 4.5).
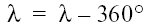
The mesoscale domain information specified by a user in the namelist is used to set up a search area for reading and storing input data in memory. Using this information, the program calculates the maximum and minimum latitude/longitude for the search area. The formulas to calculate the latitude/longitude (λ, φ) from mesoscale grid indices (I, J) and vice versa for different map projections can be found in the documentation "Terrain and Land Use for the Fifth-Generation Penn State/NCAR Mesoscale Modeling System (MM5): Program TERRAIN", page 10-17.
 |
(4.3) |
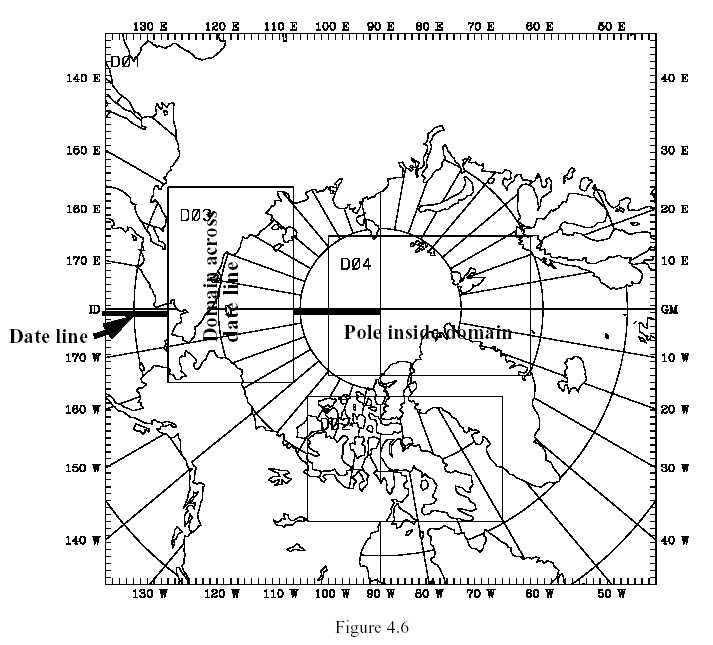
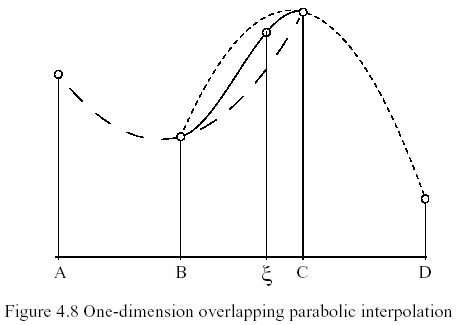
There are 3 types of vegetation/land-use data with different number of categories (N = 13, 17 or 25, see Table 4.1b, 4.1c, and 4.1d) and one type of soil data with 17 categories (Table 4.1g) available. At each data point, there are N numbers of percentage values for the N categories in the source data with 1-deg, 30-, 10-, 5- and 2-min resolution. The overlapping parabolic interpolation method is applied to obtain the percentages for each vegetation/land-use or soil categories at the mesoscale grid. If the water coverage (category 7, 15, or 16 for 13-, 17-, 25-category vegetation/land-use data, respectively, and category 14 for 17-category soil data) is more than 50% at the point, the category with the maximum percentage (water) will be assigned to that point. If the water coverage is less than 50%, the category with the maximum percentage excluding the water will be assigned to that point.
When the 30-sec vegetation/land-use and soil source data are used, the overlapping parabolic interpolation method cannot be applied to obtain the percentages at the mesoscale grids because the source data are represented by the category ID numbers. Another algorithm was developed to calculate the percentages at the mesoscale grids. The same rule used for the lower resolution data above was also used to determine the dominant category at each of the mesoscale grid points.
The overlapping parabolic interpolation method is also applied to obtain values of the monthly vegetation fraction and annual deep soil temperature at the mesoscale grid points. For the vegetation fraction, there are 12 monthly values of percentages assigned to each of the mesoscale grid points, and for the annual deep soil temperature, there is one value at each grid point.
Because the resolution of the deep soil temperature data is rather low (1-deg), its value at some `land points' cannot be obtained from the interpolation procedure. To remedy this problem, the following two steps are taken:
(1) A weighted averaged value from the neighbor points is assigned to those points.
(2) If the temperature still cannot be found for the small isolated islands, a latitude-based value from the formula in section 4.2.3 is assigned to the point.
After the mesoscale fields of the terrain elevation, vegetation/land-use, soil, and vegetation fraction are produced, the land-water mask data, or EZFUDGE function (just for elevation) are used to correct the land/water boundaries.
The input vegetation/land-use and soil data to TERRAIN are the percentage values (1-deg, 30-, 10-, 5- and 2-min data) or ID numbers (30-sec data) for the N categories on the latitude/longitude grid. The output from TERRAIN is the dominant category ID number on the mesoscale grid. In the MM5 model without LSM, the dominant vegetation/land-use category ID number will be translated to the physical parameters of the surface characteristics, such as albedo, moisture availability, emissivity, roughness length, and thermal inertia, etc., as shown in Tables 4.2a-c for the three types of landuse data (which are provided in the MM5/Run/LANDUSE.TBL file). For the LSM option in MM5, given the dominant category ID numbers of vegetation and soil, the land properties are defined in the model. A vegetation fraction field is derived based on the model time and monthly vegetation fraction fields (which is assumed to be valid in the middle of each month) from TERRAIN.
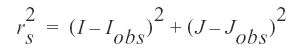
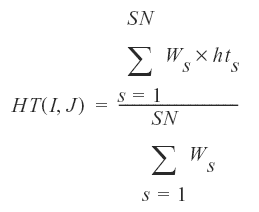
The weighting function is defined as
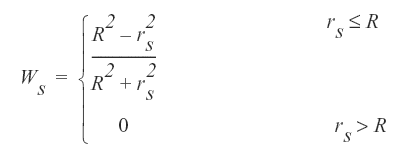 |
(4.4) |
 |
(4.5) |
 |
(4.6) |
In the TERRAIN program, both of the overlapping parabolic interpolation and Cressman-type objective analysis methods are available as the interpolation options for terrain elevation. No systematic comparison with these two methods is performed. They are kept in the current program for historical reason (they are from TERRAIN program of MM4 modeling system). In general, a large radius of influence will give a smoother results (with less terrain gradient). When a small radius of influence is used. it may cause "no data available" error for certain grid boxes if a lower resolution dataset is used. It is recommended that a user should choose the source dataset with the resolution comparable to the grid distance of the given domain.
When MM5 is applied for a multiple-nest simulation, each of the nest domains obtains their lateral boundary condition from their mother domain during the integration, and feeds the results back to the mother domain in the two-way nested application. After the terrain height, land-use and other terrestrial files are produced for each domain, the following procedure must be completed to make the terrain height, land-use and other terrestrial fields consistent between the domains:
For both 1-way and 2-way nests, these steps are taken to reset nest boundary values:
1. Interpolate the mother domain's terrain heights to the nest grid by using the monotonic interpolation scheme (ratio=3), or bi-parabolic interpolation scheme (ratio≠3).
2. For rows and columns 1 to 3 (2-way) or 1 to 4 (one-way) along the nest domain boundaries, terrain heights are replaced with mother domain's values.
3. For rows and columns 4 to 6 (2-way) or 5 to 7 (one-way), blending the nest domain's values with mother domain's values.
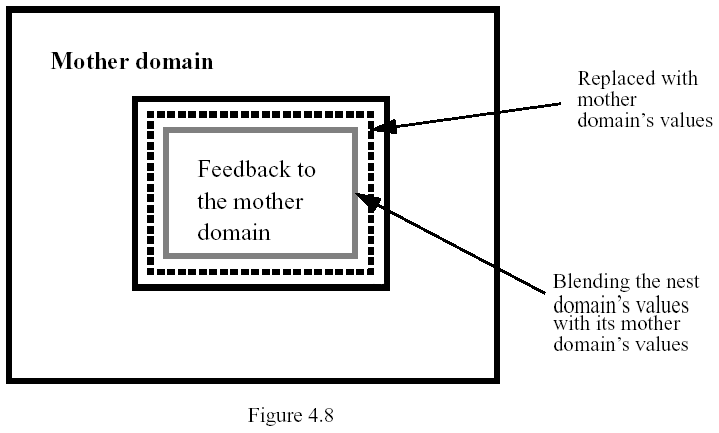
User must leave enough space (at least 5 grid-points) between the nest's boundary and its mother domain's boundary so that the (high-order) interpolation can be applied. If there is not enough space between the boundaries, the program will stop and issue a warning message.
The interior values of terrain, land-use and other terrestrial fields in a nest-domain are used to overwrite the mother domain values for the two-way nest application. This is necessary to ensure that at the coinciding grid points between the nests, the terrestrial values are identical for all the domains. This is done from the finest nest domain down to the coarsest domain.
If a user chooses to use the 24-category land-use data (VEGTYPE = 1), or to process the LSM data (LSMDATA = .T.), or not to use EZFUDGE function (IFEZFUG = .FALSE.; all namelist-controlled options), the land-water mask files generated based on the vegetation data are used to correct the vegetation/land-use, soil categories, vegetation fraction, and the elevation of water bodies. This is recommended as the vegetation data provide fairly accurate representation of land mass, and in most cases (e.g. outside US) have better resolution than map information from NCAR Graphics.
NCAR Graphics' mapping utility may be used to identify water bodies. The information from a call to ARGTAI can be used to correct the land-use categories and the elevation of water bodies. When the IFEZFUG = .T., the inland spurious lakes can be eliminated, and the terrain heights are also matched with the coastline better. The heights of some of the larger lakes in the US have been defined in the namelist EZFUDGE, a user can define more lakes in this namelist. We recommend that users set IFEZFUG = .T. to correct possible errors from the source land-use data only if VEGTYPE = 1and LSMDATA = FALSE. This is because of data used in NCAR Graphics are rather old, the coastlines for many parts of the world are very coarse and some are even incorrect. Using land-water mask files can make the coastlines more realistic. Using IFEZFUG = .T. may require more computer memory and CPU time.
To skip this EZFUDGE option over special areas, turn the switch IFTFUG on and specify the LAT/LON boxes in the namelist FUDGET.
After the TERRAIN program is finished, a user should check the results carefully. Sometime the program does not generate satisfactory land-use categories at some grid points due to errors in the original dataset, or sometimes a user may want to modify the land-use categories in their numerical experiments. TERRAIN provides the user another chance to modify the land-use categories at upto 200 grid points for each domain. In the namelist, the switch IFFUDG = .T. allows a user to fudge the land-use data point by point. The locations (IFUG, JFUG) and land-use values (LNDFUG) are specified in namelist FUDGE. After the namelist variables IFFUG, NDFUG, IFUG, JFUG, LNDFUG are modified, the user needs to run the TERRAIN program again to get the corrected land-use data output.
ftpdata |
Switch to indicate whether one wants to ftp data (T) or not (F). |
Where30sTer |
Switch to indicate where tiled global 30-s dataset is. = ftp: ftp data; = directory: data have been ftp'ed, untared, and reside in local directory |
users |
Users from inside NCAR set users = MMM, otherwise set users = Others. This causes the terrain job script to use a different ftp script to ftp data. |
BotSoil |
Uncomment this line to obtain bottom soil layer (30 - 100 cm) data. |
parame.incl |
To specify the maximum dimensions ( IIMX, JJMX) of any domains (expanded or non expanded). |
paramed.incl |
To specify the maximum dimensions (ITRH, JTRH) of array holding the source data. They depend on source data resolution, and map projection, etc. |
PHIC |
Central latitude of the coarse domain in degrees North; latitudes in SH is negative. |
XLONC |
Central longitude of the coarse domain in degrees East. Longitudes between Greenwich and Dateline is negative. |
IEXP |
Logical flag to use the expanded coarse domain (T) or not (F). |
AEXP |
Approximate expansion (km) of the grid on all sides of the coarse domain. |
IPROJ |
Map projection: 'LAMCON' for Lambert Conformal, 'POLSTR' for Polar Stereographic, and 'MERCAT' for Mercator. |
MAXNES |
Maximum number of domains. The TERRAIN program allows the maximum number of domains less than or equal to 100. |
NESTIX |
The I(y)-direction dimensions for each of the domains. |
NESTJX |
The J(x)-direction dimensions for each of the domains. |
DIS |
The grid distance for each of the domains in km. |
NUMNC |
The mother domain's ID number for each of the domains. For the coarse domain, always set NUMNC=1. |
NESTI |
The I location in its mother domain of the nest domain's low-left corner --- point (1,1). |
NESTJ |
The J location in its mother domain of the nest domain's low-left corner --- point (1,1). |
RID |
The radius of influence in unit of grid points used only for Cressman type objective analysis (IFANAL=T). |
NTYPE |
The source terrain height and land-use data type for each of the domains:1=one degree; 2=30 min.; 3=10min.; 4=5 min.; 5=2 min.; 6=30 sec. |
NSTTYP |
To indicate the nest type: 1=one way nest; 2=two way nest. |
IFTER |
Logical flag to indicate to create terrain height and other terrestrial fields, =T; or map background only, =F. |
IFANAL |
Interpolation method: .T. -- Cressman type objective analysis; .F. -- Overlapping parabolic interpolation. |
ISMTHTR |
To choose smoothing method: 1= 1-2-1 smoother; 2= smoother/desmoother. |
IFEZFUG |
To activate the EZFUDGE function: .T. turns on; .F. is off. |
IFFUDG |
Need to do land-use fudging (T) or not (F). |
IFTFUG |
Need to skip the EZFUDGE function over certain areas (T) or not (F). |
IPRINTD |
Print out the latitude and longitude of the mesoscale grids (T) or not (F). |
IPRTHT |
Print out all processing fields on the mesoscale grids (T) or not (F). |
IPRINT |
= 1: A lot more print output in terrain.print.out. Helpful when error occurs. |
FIN |
Contour interval (meter) of terrain height plots. |
TRUELAT1 |
The first true latitude for the map projection. Default value = 91.0 means the standard values will be used for the projections. True lat/long may only be changed for Lambert-Conformal and Polar stereograhic projections. |
TRUELAT2 |
The second latitude for the map projection. Default value = 91.0 means the standard value will be used for the projections. (Use this for Lambert-Conformal projection only.) |
IFILL |
Plots are color filled (T) or not (F). |
LSMDATA |
Switch to indicate whether to create vegetation, soil, vegetation fraction, and deep soil temperature files for LSM in MM5. |
VEGTYPE |
Switch to indicate which vegetation dataset to use. = 0: use old 13-category dataset; =1: use 24-category USGS dataset; =2: use 16-SiB category dataset. |
VSPLOT |
Switch to indicate whether to plot the dominant vegetation, soil, and vegetation fraction (T) or not (F). |
IEXTRA |
Switch to indicate whether to output and plot the percentage values of vegetation and soil types. Required for ISOIL=3 or Pleim-Xiu LSM option in MM5. |
IFFUG |
To indicate which domains need to be fudged (T) or not (F). |
NDFUG |
The number of fudge points for each of the domains. The maximum of NDFUG is 200, that means that user can fudge maximum of 200 points for land-use for each of the domains. |
IFUG |
The I location of the fudge points for each of the domains. IFUG is a 2-dimension array IFUG(200,100), the first index is corresponding to points, and the second index corresponding to domains. |
JFUG |
The J location of the fudge points for each of the domains. |
LNDFUG |
The land-use category of the fudge points for each of the domains. |
Note: The maximum number of boxes is 10. The user can use STARTLAT(10),..., to specify the boxes over which no EZFUDGE is to be done.
| STARTLAT |
The latitudes of the lower-left corner of the area. |
| ENDLAT |
The latitudes of the upper-right corner of the area. |
| STARTLON |
The longitudes of the lower-left corner of the area. |
| ENDLON |
The longitudes of the upper-right corner of the area |
The heights of the water bodies can be specified in the record EZFUDGE in the namelist file as follows. The index in parenthesis refers to a specific water body that can be found in file "ezids" which are known to NCAR Graphics. For the Great Lakes in US, the heights have already been specified. Users can add more water body's surface heights, in meters above sea level only if the water bodies are identifiable in NCAR Graphics.
1. Get the source code. The current TERRAIN release resides on NCAR's anonymous ftp site, ftp.ucar.edu:mesouser/MM5V3/TERRAIN.TAR.gz. You may download TERRAIN.TAR.gz to your working directory from the web page, ftp://ftp.ucar.edu/mesouser/MM5V3. Or you can copy it from ~mesouser/MM5V3/TERRAIN.TAR.gz on NCAR's SCD machines.
2. Create the terrain.deck. Uncompress ("gunzip TERRAIN.TAR.gz") and untar ("tar -xvf TERRAIN.TAR") the file, a directory TERRAIN will be created. Go into the TERRAIN directory, and type "make terrain.deck", which creates a cshell script, terrain.deck. This deck is created specifically for your computer.
If your system does not have NCAR Graphics, you must modify the "Makefile" in the TERRAIN/ directory, set NCARGRAPHICS = NONCARG, and remove the libraries in LOCAL_LIBRARIES line.
Note that the TERRAIN program does not require NCAR Graphics to run, but having it will make life a lot easier because you can see where you have set your domains. Although NCAR Graphics is a licensed software, but part of it has become free to download. See NCAR Graphics Web page for details: ngwww.ucar.edu.
3. Edit terrain.deck. There are three parts in terrain.deck that need to be edited:
(a) Shell variables: ftp, Where30sTer, and users. Instructions on how to set these shell variables can be found in terrain.deck, or refer to section 4.7 in this chapter.
(b) Parameter statements in parame.incl and paramed.incl (edit them in the terrain.deck): parameters IIMX and JJMX in parame.incl are used to declare the arrays holding the mesoscale gridded data, while parameters ITRH and JTRH in paramed.incl are used to declare the arrays holding the input lat/lon data (refer to the instructions in terrain.deck or section 4.8 in this chapter).
(c) Records in terrain.namelist: MAPBG, DOMAINS, and OPTN.
In case you would like to fudge the land-use, or add more heights of water bodies, the records FUDGE, FUDGET, and EZFUDGE need to be modified. Refer to the instructions in terrain.deck or section 4.9 in this chapter.
4. Run terrain.deck by typing "./terrain.deck"
TERRAIN needs two kinds of inputs: (a) terrain.namelist and (b) data files for elevation, landuse, etc.. The terrain.namelist is created from terrain.deck, and the necessary data files are obtained from ftp sites based on the types of data user specifies in the namelist. Beware that the minimum size of downloaded data from ftp site is 57 Mb, and it can go up to 362 Mb if one requests the USGS landuse data and land-water mask data. It will require a few Gb of disk space to host 30 sec datasets.
5. Check your output. TERRAIN has three kinds of output:
(a) A log file from compilation: make.terrain.out, and a print file from running the program: terrain.print.out.
Check make.terrain.out to see if compilation is successful.
Check terrain.print.out to see if the program runs successfully.
When the TERRAIN job is successful, you should get a message
"== NORMAL TERMINATION OF TERRAIN PROGRAM =="
at the end of the terrain.print.out file. If the TERRAIN job failed, you can also find error messages and look for clues in this file.
(b) A plot file, TER.PLT (or gmeta), if NCAR Graphics is used (type idt TER.PLT to view);
Because the TERRAIN is the first component of MM5 modeling system and it produces constant fields used in the model, we use NCAR Graphics in the program to produce plots for users to check the output carefully.
When LSMDATA = FALSE, there are 7 frames plotted for each of the domains: map background, color and black/white terrain height, land-use (vegetation), mesh, schematic raob station map, a map showing the rest of the nests (6 frames only for the finest domain without the last map).
When LSMDATA = TRUE, there are additional 15 frames plotted: deep soil temperature, soil category, 12 monthly vegetation fraction percentages, land-water mask.
When IEXTRA = TRUE, more frames will be plotted.
(c) Binary files, TERRAIN_DOMAIN1, TERRAIN_DOMAIN2, ......;
These are the terrestrial data files for each of the mesoscale domains used by REGRID, MM5 or NESTDOWN. You may check the size of each of the files to make sure the files were created correctly (not having a zero size).
If you are going to recompile, it is best to type `make clean' first. It will remove all generated files (which include object files and executables).
This command removes downloaded data in Data/ directory, and Data30s/ directory itself.
If the TERRAIN job fails, check to see if one of the following is a possibility:
terrain.exe - main terrain executable
rdnml - utility to read namelist variables and figure out what data to download
data_area.exe - utility to figure out which 30 sec elevation data tile to download
rdem.exe - utility to read the 30 sec elevation data and reformat it for terrain program
If they are not generated, check make.terrain.out file for compiler errors. To recompile, type
setenv NCARG_ROOT /usr/local or /usr/local/ncarg
This is required for making plots using NCAR Graphics.
Table 4.3 List of shell names, fortran unit numbers and their description for TERRAIN
The terrain.tar file contains the following files and directories
CHANGES |
Description of changes to Terrain program |
| Data/ |
Data directory |
| Makefile |
Makefile to create terrain.deck and executable |
| README |
General information about the Terrain directory |
| Templates/ |
Job deck and tables directory |
| con.tbl |
Table file for terrain height plot |
| confi.tbl |
Table file for color terrain height plot |
| confiP.tbl |
Table file for vegetation fraction percentages plots |
| confiT.tbl |
Table file for deep soil temperature plot |
| ezids |
File for NCAR Graphics geographic area identifier |
| lsco.tbl |
Table file for soil category plot |
| luco.tbl |
Table file for old land-use plot |
| lvc1.tbl |
Table file for SiB vegetation category plot |
| lvc2.tbl |
Table file for USGS vegetation category plot |
| map.tbl |
Table file for plots |
| maparea.tbl |
Table file for plots |
| mapfi.tbl |
Table file for plots |
| raobsta.ieee |
Radiosonde locations for plot |
| src/ |
Terrain source code |
paramesv0.incl and vs_data0.incl are the parameters and data statements for SiB data.
paramesv1.incl and vs_data2.incl are the parameters and data statements for USGS data.
In the Data/ directory, namelists for USGS and SiB input files are present. These namelists will be cat'ed to terrain namelist file during the run. Also present in the directory are the ftp scripts to ftp general terrain data from NCAR ftp site and 30 second USGS terrain dataset from USGS ftp site. These ftp scripts may be run separately from the Terrain program to obtain data.
If users have their own vegetation, soil data with different definitions, these parameter and data statement files must be created as well as the corresponding color tables for plots.
# Set this if you would like to ftp terrain data
# Set the following for ftp'ing 30 sec elevation data from USGS ftp site
#set Where30sTer = /your-data-directory
if ( $Where30sTer == ftp) then
# Use this if you are ftping from other places
# Use this if you are ftping from inside NCAR
# Uncomment the following line if using the 30-100 cm layer soil file
# --------------------------------------------------------------
# 1. Set up parameter statements
# --------------------------------------------------------------
cat > src/parame.incl.tmp << EOF
C IIMX,JJMX are the maximum size of the domains, NSIZE = IIMX*JJMX
PARAMETER (IIMX = 100, JJMX = 100, NSIZE = IIMX*JJMX)
cat > src/paramed.incl.tmp << EOF
C ITRH,JTRH are the maximum size of the terrain data.
C NOBT = ITRH*JTRH, here assuming
C ITRH= 270 ( 45 deg. in north-south direction, 10 min. resolution)
C JTRH= 450 ( 75 deg. in north-south direction, 10 min. resolution)
C IF USING GLOBAL 30SEC ELEVATION DATASET FROM USGS, NEED TO SET
C BOTH ITRH AND JTRH BIG. TRY THE COMMENTED PARAMETER LINE FIRST.
C THIS WILL REQUIRE APPROXI 0.9 GB MEMORY ON A 32-BIT IEEE MACHINE.
C AN ESTIMATE OF THE DIMENSION SIZE CAN BE MADE FROM Data30s/rdem.out
C AFTER THE FIRST JOB FAILS. USE (XMAXLAT-XMINLAT)*120 TO ESTIMATE
C ITRH, AND (XMAXLON-XMINLON)*120 TO ESTIMATE JTRH.
PARAMETER (ITRH = 500, JTRH = 500, NOBT = ITRH*JTRH)
C PARAMETER (ITRH = 1500, JTRH = 1800, NOBT = ITRH*JTRH)
# --------------------------------------------------------------
# --------------------------------------------------------------
if ( -e terrain.namelist ) rm terrain.namelist
PHIC = 36.0, ; CENTRAL LATITUDE (minus for southern hemesphere)
XLONC = -85.0, ; CENTRAL LONGITUDE (minus for western hemesphere)
IEXP = .F., ; .T. EXPANDED COARSE DOMAIN, .F. NOT EXPANDED.
; USEFUL IF RUNNING RAWINS/little_r
AEXP = 360., ; APPROX EXPANSION (KM)
IPROJ = `LAMCON', ; LAMBERT-CONFORMAL MAP PROJECTION
;IPROJ = `POLSTR', ; POLAR STEREOGRAPHIC MAP PROJECTION
;IPROJ = `MERCAT', ; MERCATOR MAP PROJECTION
MAXNES = 2, ; NUMBER OF DOMAINS TO PROCESS
NESTIX = 35, 49, 136, 181, 211, 221, ; GRID DIMENSIONS IN Y DIRECTION
NESTJX = 41, 52, 181, 196, 211, 221, ; GRID DIMENSIONS IN X DIRECTION
DIS = 90., 30., 9., 3.0, 1.0, 1.0, ; GRID DISTANCE
NUMNC = 1, 1, 2, 3, 4, 5, ; MOTHER DOMAIN ID
NESTI = 1, 10, 28, 35, 45, 50, ; LOWER LEFT I OF NEST IN MOTHER DOMAIN
NESTJ = 1, 17, 25, 65, 55, 50, ; LOWER LEFT J OF NEST IN MOTHER DOMAIN
RID = 1.5, 1.5, 1.5, 3.1, 2.3, 2.3, ; RADIUS OF INFLUENCE IN GRID UNITS (IFANAL=T)
NTYPE = 2, 3, 4, 6, 6, 6, ; INPUT DATA RESOLUTION
; 1: 1 deg (~111 km) global terrain and landuse
; 2: 30 min ( ~56 km) global terrain and landuse
; 3: 10 min ( ~19 km) global terrain and landuse
; 4; 5 min ( ~9 km) global terrain and landuse
; 5; 2 min ( ~4 km) global terrain and landuse
; 6; 30 sec ( ~.9 km) global terrain and landuse
NSTTYP= 1, 2, 2, 2, 2, 2, ; 1 -- ONE WAY NEST, 2 -- TWO WAY NEST
IFTER = .TRUE., ; .T.-- TERRAIN, .F.-- PLOT DOMAIN MAPS ONLY
IFANAL = .F., ; .T.-- OBJECTIVE ANALYSIS, .F.-- INTERPOLATION
ISMTHTR = 2 , ; 1: 1-2-1 smoother, 2: two pass smoother/desmoother
IFEZFUG = .F., ; .T. USE NCAR GRAPHICS EZMAP WATER BODY INFO TO FUDGE THE LAND USE
IFTFUG = .F., ; .T. DON'T DO EZFUDGE WITHIN THE USER-SPECIFIED
; LAT/LON BOXES, need to define namelist fudget
IFFUDG = .F., ; .T. POINT-BY-POINT FUDGING OF LANDUSE,
; need to define namelist fudge
IPRNTD = .F., ; PRINT OUT LAT. AND LON. ON THE MESH
IPRTHT = .F., ; PRINT OUT ALL PROCESSING FIELDS ON THE MESH
IPRINT = 0, ; = 1: A LOT MORE PRINT OUTPUT IN terrain.print.out
FIN = 100., 100., 100., 100., 100., 100., ; CONTOUR INTERVAL (meter) FOR TERRAIN HEIGHT PLOT
;TRUELAT1=91., ; TRUE LATITUDE 1
;TRUELAT2=91., ; TRUE LATITUDE 2, use this if IPROJ='LAMCON'
IFILL = .TRUE., ; .TRUE. --- color filled plots
LSMDATA = .FALSE., ; .TRUE. --- Create the data for LSM
VEGTYPE = 1, ; LANDUSE DATA TYPE: =0: old 13 cat; =1: 24 cat USGS; =2: 16 cat SiB
VSPLOT = .TRUE., ; .TRUE. --- plot Vege., Soil, Vege. Frc. percentages.
IEXTRA = .FALSE., ; .TRUE. --- Create extra data for Pleim-Xiu LSM
; USE ONLY IF IFFUDG = .T., POINT-BY-POINT FUDGING OF LANDUSE,
; IFFUG FOR EACH OF THE NESTS: .F. NO FUDGING, .T. FUDGING
IFFUG = .F.,.F., ; FUDGE FLAGS
; NDFUG : THE NUMBER OF FUDGING POINTS FOR EACH OF NESTS
; LOCATION (I,J) AND LANDUSE VALUES FOR EACH OF THE NESTS
; NOTE: REGARDLESS OF IFFUG AND NDFUG, 200 VALUES MUST BE GIVEN FOR
; EACH NEST, OR ELSE THE INDEXING WILL GET MESSED UP
; The example below is for two domains. Add more for domain 3 and up
; if needed. Do not remove 0 values for domain 1 and/or 2 even
IFUG(1,1)= 200*0, ; I location for fudge points in domain 1
IFUG(1,2)= 200*0, ; I location for fudge points in domain 2
JFUG(1,1)= 200*0, ; J location for fudge points in domain 1
JFUG(1,2)= 200*0, ; J location for fudge points in domain 2
LNDFUG(1,1)= 200*0, ; land-use value at fudge points for domain 1
LNDFUG(1,2)= 200*0, ; land-use value at fudge points for domain 2
; USE ONLY IF IFTFUG=.T., WHICH MEANS TERRAIN WON'T DO EZFUDGE WITHIN
; THE USER-SPECIFIED LAT/LON BOXES. THIS OPTION IS USED WHEN THERE
; ARE INLAND BODIES OF WATER THAT ARE DEFINED IN THE LAND USE
; DATA SET BUT NOT IN THE EZMAP DATA SET. THIS OPTION PREVENTS
; THOSE BODIES OF WATER FROM BEING WIPED OUT BY EZFUDGE
NFUGBOX = 2 ; NUMBER OF SUBDOMAINS IN WHICH TO
; TURN OFF EZMAP LAND USE FUDGING
STARTLAT=45.0,44.0, ; LATITUDES OF LOWER-LEFT CORNERS OF SUBDOMAINS
ENDLAT =46.5,45.0, ; LATITUDES OF UPPER-RIGHT CORNERS OF SUBDOMAINS
STARTLON=-95.0,-79.8, ; LONGITUDES OF LOWER-LEFT CORNERS OF SUBDOMAINS
ENDLON =-92.6,-78.5, ; LONGITUDES OF UPPER-RIGHT CORNERS OF SUBDOMAINS
; USE ONLY IF IFEZFUG=.T., WHICH TURNS ON EZMAP WATER BODY FUDGING OF LANDUSE.
; USERS: FEEL FREE TO ADD ANY MORE LAKE SURFACE HEIGHTS THAT YOU'LL NEED.
; HTPS IS THE HEIGHT IN METERS AND THE INDEX OF HTPS CORRESPONDS TO THE ID
; OF THE `PS' AREA IN THE FILE ezmap_area_ids.
HTPS(441) = -.001 ; Oceans -- Do NOT change this one
HTPS(550) = 183. ; Lake Superior
HTPS(587) = 177. ; Lakes Michigan and Huron
HTPS(618) = 176. ; Lake St. Clair
HTPS(645) = 75. ; Lake Ontario
HTPS(480) = 1897. ; Lake Tahoe
HTPS(500) = 1281. ; Great Salt Lake
# ------------------------------------------------------------------------------
# ------------------------------------------------------------------------------
# Check to see if recompilation is needed
# Need to make here so that rdnml may be used
../Templates/incldiff.sh parame.incl.tmp parame.incl
../Templates/incldiff.sh paramed.incl.tmp paramed.incl
# Create a namelist without comments
sed -f Templates/no_comment.sed terrain.namelist | grep "[A-Z,a-z]" > terlif.tmp
mv terlif.tmp terrain.namelist
# Set default script variables
set DataType = `src/rdnml < terrain.namelist`
if ( $DataType[4] == 1 ) set IfProcData
if ( $DataType[4] == 0 ) set ftpdata = false
if ( $DataType[5] == 1 ) set LandUse = USGS
if ( $DataType[5] == 2 ) set LandUse = SiB
if ( $DataType[3] == 1 ) set IfUsgsTopo
# reset LandUse if BotSoil is set
if ( $?BotSoil ) set LandUse = USGS2
rm ${ForUnit}1* ${ForUnit}2* ${ForUnit}4*
if ( $LandUse == OLD ) cat Data/namelist.usgsdata >> terrain.namelist
if ( $LandUse == USGS ) cat Data/namelist.usgsdata >> terrain.namelist
if ( $LandUse == USGS2 ) cat Data/namelist.usgsdata2 >> terrain.namelist
if ( $LandUse == SiB ) cat Data/namelist.sibdata >> terrain.namelist
cat endnml >> terrain.namelist
ln -s terrain.namelist ${ForUnit}15
ln -s raobsta.ieee ${ForUnit}16
# ----------------------------------------------------------------------
# Update parameter statements for vegetation dataset
# (may require partial recompilation)
cp src/paramesv0.incl src/paramesv.incl.tmp
./Templates/incldiff.sh src/paramesv.incl.tmp src/paramesv.incl
cp src/vs_data0.incl src/vs_data.incl.tmp
./Templates/incldiff.sh src/vs_data.incl.tmp src/vs_data.incl
else if ( $LandUse == USGS ) then
cp src/paramesv1.incl src/paramesv.incl.tmp
./Templates/incldiff.sh src/paramesv.incl.tmp src/paramesv.incl
cp src/vs_data2.incl src/vs_data.incl.tmp
./Templates/incldiff.sh src/vs_data.incl.tmp src/vs_data.incl
# ----------------------------------------------------------------------
if ( $ftpdata == true && $?BotSoil ) then
# ftp other data plus bottom soil data
# ftp other data plus top soil data
if ( $?IfUsgsTopo && $IfProcData ) then
echo `about to start ftping 30 sec tiled elevation data from USGS'
./ftp30s.csh $Where30sTer $users >& ftp30s.out
# ----------------------------------------------------------------------
./terrain.exe >&! terrain.print.out