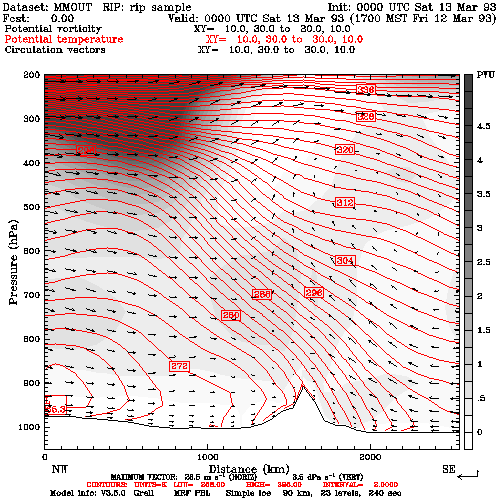
feld=pvo; ptyp=vc; crsa=10,30;
crsb=30,10; vcor=p; vwin=1050,200; cint=.25;>
cmth=fill; cosq=0,white,4,dark.gray; cbeg=0; cend=5
feld=the; ptyp=vc;
cint=2; colr=red
feld=uuu,vvv,omg; ptyp=vv
feld=tic; ptyp=vb
-
Field Potential Vorticity is plotted (feld=pvo),
as a vertical contour plot (ptyp=vc), the cross section is 10,30
to 30,10 (crsa=10,30;crsb=30,10), the verticval coordiante is pressure
(vcor=p), the windown will be form 1050 to 200 hPa (vwin=1050,200),
contour intervals are set to .25 (cint=.25), the contouring method
is filling (cmth=fill), the colors will be white to dark gray
(cosq), and the minumum and maximum values is set at 0 and 5 (cbeg=0;
cend=5)
-
Overlayed is Potential temperature (feld=the),
as a vertical contour plot (ptyp=vc), contour intervals are set
to 2 (cint=2), and they will be plotted in red (colr=red)
-
Overlayed is circular wind vectors (feld=uuu,vvv,omg),
as a vertical vector plot (ptyp=vv)
-
Overlayed is tic markings (feld=tic),
which is plotted as a vertical background plot (ptyp=bb)
-
This frame will be plotted for every time
period
