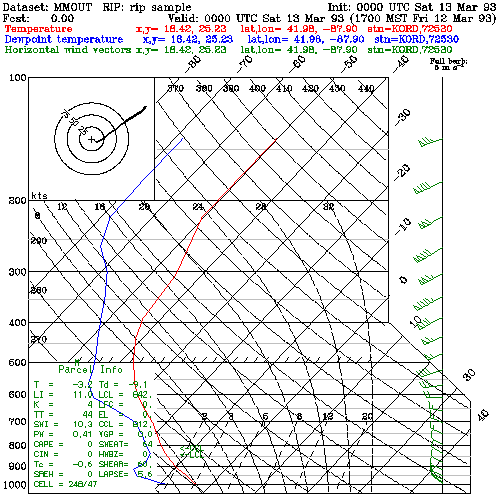
feld=tic; ptyp=sb; sloc=KORD;
hodo; sndg
feld=tmc; ptyp=sc;
colr=red
feld=tdp; ptyp=sc;
colr=blue
feld=uuu,vvv; ptyp=sv;
colr=dark.green; hodo; sndg
-
Plot background marking (feld=tic),
as a sounding background plot (ptyp=sb), for the station KORD (sloc=KORD
- see station list for station names), plot a hodogram (hodo),
as well as sounding parameters (sndg)
-
Plot temperature in degrees C (feld=tmc),
as a sounding contour (ptyp=sc) and plot this in red (colr=red)
-
Plot dew point temperatures (feld=tdp),
as a sounding contour plot (ptyp=sc) and plot this in blue (colr=blue)
-
Plot wind vectors (feld=uuu,vvv), as
a sounding vertical plot (ptyp=sv), plot all in dark green (colr),
plot a hodogram (hodo), as well as sounding parameters (sndg)
-
This will be plotted at all time periods
