feld=tmc; ptyp=hc; vcor=p;
levs=850,700,-300,100; cint=2; cmth=fill;>
cosq=-32,light.violet,-24,violet,-16,blue,-8,green,0,yellow,8,red,>
16,orange,24,brown,32,light.gray
feld=ght; ptyp=hc;
cint=30; linw=2
feld=uuu,vvv; ptyp=hv;
vcmx=-1; colr=white; intv=5
feld=map; ptyp=hb
feld=tic; ptyp=hb
-
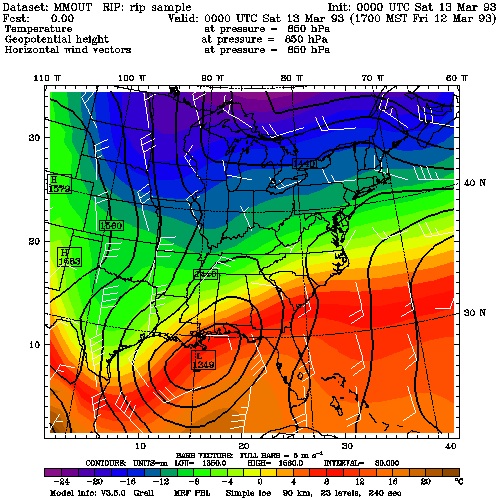
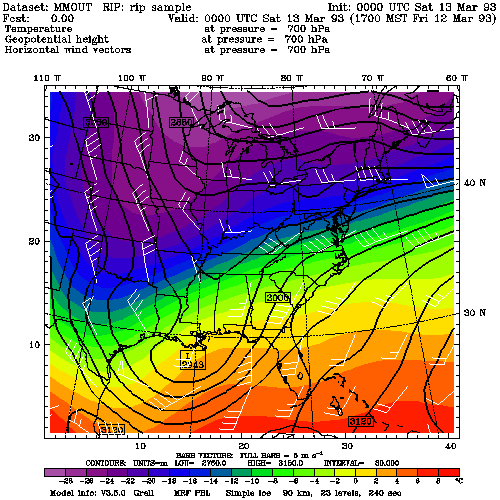
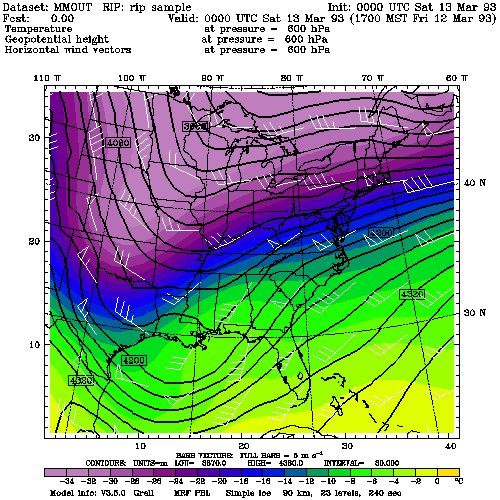
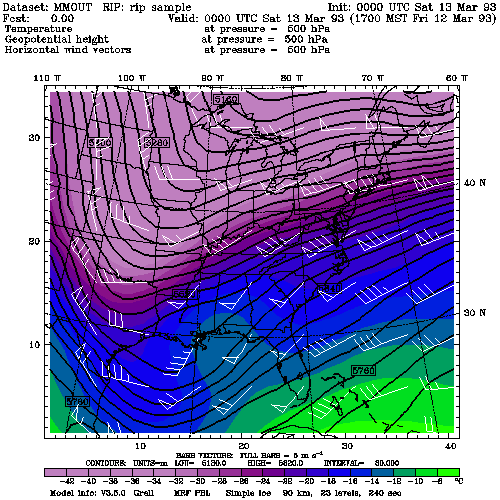
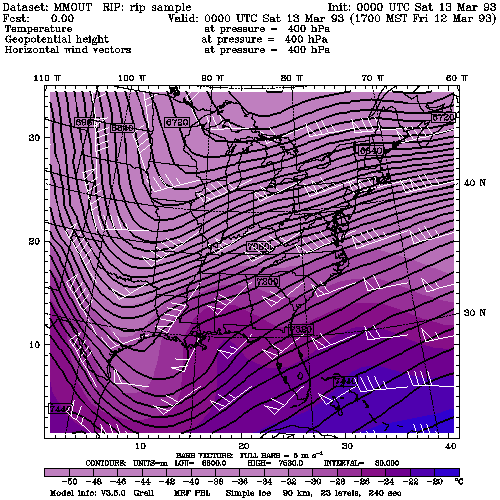
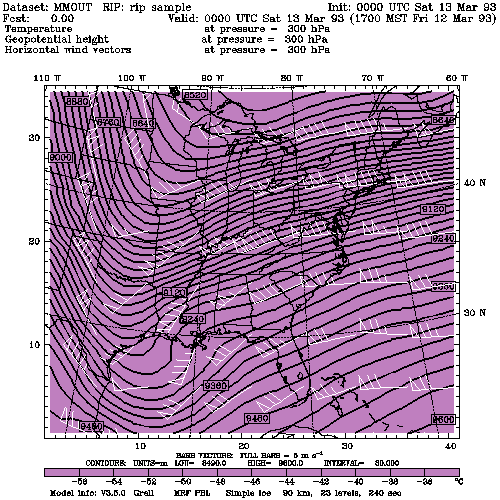
Field Temperature in degrees C is plotted
(feld=tmc), as a horizontal contour plot (ptyp=hc), fileds
will be plotted on pressure levels (vcor=p), lelves 850, 700, 600,
500, 400, 300 will be plotted (levs=850,700,-300,100 - first 850, then
700 to 300 in intervals of 100)), contour intervals are set to 2 (cint=2),
the contouring method is filling (cmth=fill), and colors will be
light violet to light gray (cosq)
-
Overlayed is geopotential height (feld=ght),
as a horizontal contour plot (ptyp=hc), contour intervals are set
to 30 (cint=30), and the line width of the contours are set to 2
(linw=2)
-
Overlayed is wind vectors (feld=uuu,vvv),
as a horizontal vector plot (ptyp=hv), plotted as barbs (vcmax=-1),
barbs will be plotted in white (colr=white) and every 5th barb will
be plotted (intv=5)
-
Overlayed is a map (feld=map), which
is plotted as a horizontal background plot (ptyp=hb)
-
Overlayed is tic markings (feld=tic),
which is also plotted as a horizontal background plot (ptyp=hb)
-
This frame will be plotted for every time
period
