Parallel MM5 benchmarks, 2004
Here to return to http://www2.mmm.ucar.edu/mm5/mpp/helpdesk .
Disclaimer
Some results on this page are contributed (as thanked below). Contributed results are provided on this page along with results from runs we conducted ourselves with the following caveat: Reasonable efforts have been made to verify contributed results, including consulting with the contributors and inspection of configuration and raw benchmark result files. We have complete confidence in the integrity and competence of the contributors; however, we assume no responsibility for nor make any claims regarding the accuracy, veracity, or appropriateness for any purpose whatsoever of contributed results. Further, all results, whether contributed or generated by us, are for a single fixed-size MM5 case on the specific machines listed, and no claim is made of representativeness for other model scenarios, code versions, or hardware installations.
Press here for end of 2003 version of Parallel MM5 2003b Benchmarks Page
Press here for older (pre-September 2003) version of Parallel MM5 2003a Benchmarks Page
Press here for the
older Parallel
MM5 2002 Benchmarks Page.
Press here for the older Parallel MM5
2001 Benchmarks Page.
Press here for the older Parallel MM5
2000 Benchmarks Page.
Click here to
download the input data for this MM5 benchmark case.
For additional information on MM5 benchmarks, please click here.
For information on the MM5 distributed-memory parallel code, please click here.
Scroll down this page for additional explanation of the figures shown here.
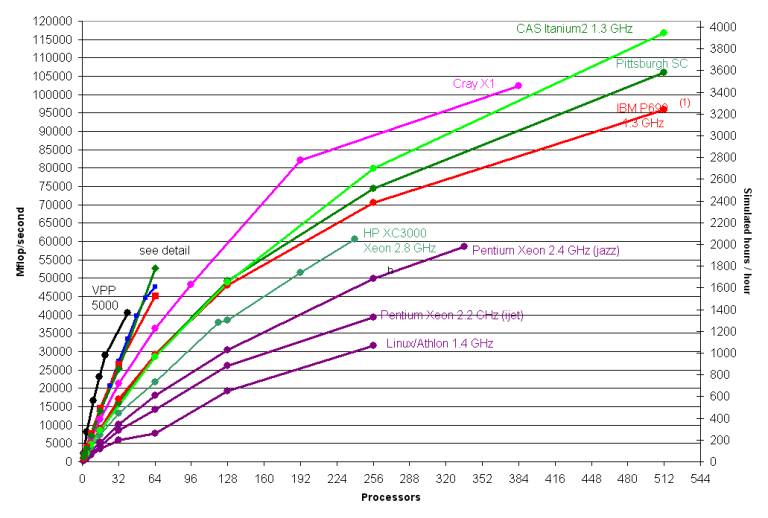
Figure 1a. MM5 floating-point performance on various platforms. (1) See notes below.
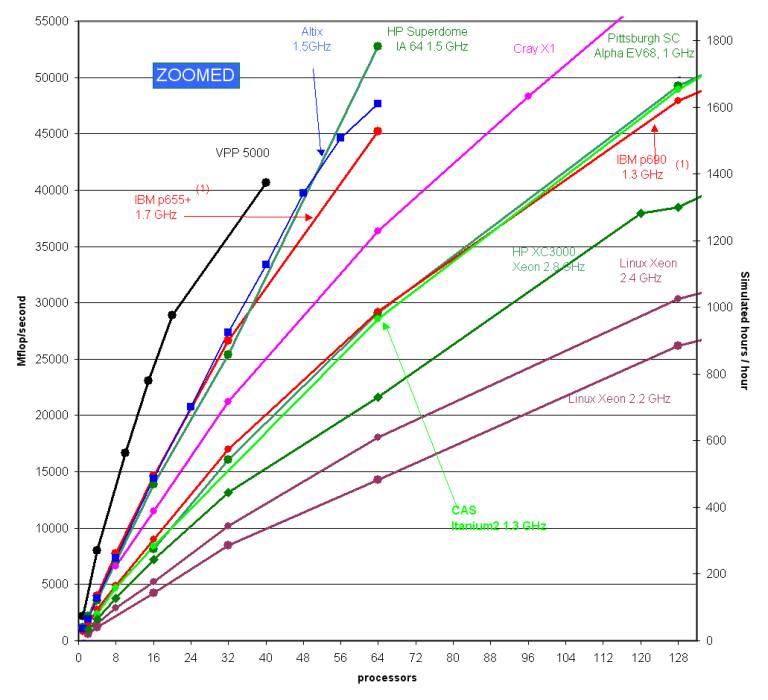
Figure 1b. MM5 floating-point performance on various platforms (zoomed). (1) See notes below.
All runs were of a 36-kilometer resolution domain over Europe; the grid
consisted of 136 cells in the east/west dimension, 112 north/south, and 33
vertical layers (503,000 cells). Time step is 81 seconds. There is a link to
the input data for this case at the top of this page. The operation count for
this scenario is 2,398 million floating point operations per average time step.
I/O and model initialization were not included in the timings. All timing runs
were performed at single (32-bit) floating-point precision. Scaling is
calculated as the speedup divided by the factor of increase in the number of
processors.
Figures 1a-b, above, show performance results in Mflop/second and in simulated hours per hour on a variety of platforms.
Timings for the Chinese Academy of Sciences cluster installed at Computer Network Information Center were conducted on 256 nodes of DEEPCOMP 6800 (4-way Intel Itanium 2 1.3GHz, 3 MB L3 Cache) servers built by Lenovo. The interconnection network is based on Quadrics QsNet. The MM5 code was compiled using Intel Fortran Compiler v7.1. Contributed; Liu Shuguang, Lenovo (OEM vendor, Beijing) (2/2004)
SGI Altix timings were conducted on an SGI Altix 3700 having 64 Itanium2 processors running at 1.5 GHz, each with a 6MB L3 cache. System memory was 256 GB. Although the system has physically distributed memory, the logical address space is unique and there was a single Linux 2.4.21 kernel image with SGI's ProPack 2.4 running in the entire 64-processor machine. The runscript set the MPI_DSM_CPULIST environment variable to ensure that consecutively-numbered processors were used for all runs, which means that for any given run all processors of a (four-processor) C-brick were used before using processors in another C-brick. The program was compiled with the Intel 8.0.040 ifort Fortran compiler and the Intel 8.0.059 icc C compiler, and linked with SGI's MPI from MPT 1.9-1. Contributed; Gerardo Cisneros, SGI (2/2004).
The HP Superdome timings were obtained on a system with 64 Itanium-2 (1.5 GHz) processors, 6 MB L3 cache. Compiler: HP F90 v2.8 (using +Ofaster +O3 +noppu +Oprefetch_latency=1920 options). Contributed; Logan Sankaran, HP (9/2003, updated 2/2004).
The HP XC3000 is a cluster of Proliant DL360-G3 nodes connected via Myrinet. Each node had two 2.8 GHz Xeon cpus and 2 GB memory. MM5 was compiled using the Intel V7.0 ifc compiler and MPICH for Myrinet. Linux was the OS on all systems. Contributed, Enda O’Brien, HP (11/2003).
The Cray X1 timings were obtained on a 128 CPU 800MHz X1 system. The x-axis is the number of single-streaming processors (SSPs) used for each run. Contributed; Peter Johnsen, Cray, and Tony Meys, Army High Performance Computing Research Center, (10/2003)
Timings for the IBM Power 4, P690 1.3 GHz were conducted on an IBM system.
Each Regatta node used in the test contained 32 processors subdivided into
8-way logical partiions (LPARS). The interconnection network is the IBM
Colony switch. Contributed; Jim Abeles, IBM (10/2003).(1)
Timings for the IBM Power 4, P655+ 1.7 GHz, were conducted using 4-way LPARS and the Colony switch. Contributed; Jim Abeles, IBM (9/2003).(1)
The Jazz timings were conducted on a 350-node Pentium/Linux cluster in the Argonne National Laboratory Laboratory Computing Resource Center. Each node has a single Xeon 2.4 GHz processor and either 1 GB or 2 GB of memory. Model was run over Myrinet 2000. The MM5 code was compiled using the Intel compiler. Contributed; John Taylor, ANL. (3/2003)
The iJet HPTi Xeon timings were conducted on iJet a Pentium/Linux cluster at NOAA Forecast Systems Laboratory. Each node has dual Xeon 2.2 GHz processors. Model was run straight-MPI over Myrinet (no-OpenMP). The MM5 code was compiled using the Intel compiler. Contributed; Craig Tierney, HPTi. (11/2002)
Timings for the Pittsburgh Supercomputer Center Terascale Computing System were conducted by J. Michalakes on October 20-21, 2001; additional runs Oct. 26 and 29. Thanks to Ralph Roskies, Sergiu Sanielevici, Roberto Gomez, and others at PSC. The 6 TFlop/s peak TCS comprises 3000 1 GHz HP Alpha EV68 processors (750 ES45 nodes). The model was run straight-MPI (no OpenMP) MPI-over-shared memory for communication within nodes and using MPI-over Quadrics for communication between nodes. These are full-node timings (i.e. using all 4 CPUs on each node) on a dedicated system. Two rails of the Quadrics interconnect were used for the Feb. 2002 updated runs. (10/23/2001; updated 10/26/2001, 2/18/2002)
The Fujitsu VPP5000 is a distributed-memory machine with vector processors linked by a high-speed crossbar interconnect. The model was run using Fujitsu's implementation of MPI and with a one-dimensional data decomposition to preserve vector length in the I-dimension.
Note:
(1) Indicated runs were conducted using a special optimization in the Reisner explicit moisture routine, EXMOISR, originally included in the MM5 benchmark code for optimization on the NEC SX/5 system. The modification entails replacing the FORTRAN power operator ‘**’ with EXP and LOG: that is, x ** y is replaced with EXP( LOG(x)*y). This option is turned on at compile time by compiling the EXMOISR routine with KMA defined as a CPP preprocessor macro.
Scaling
The following table shows scaling
information for the machines tested.
Scaling efficiency is computed as the percentage of ideal speedup as the
number of processors increase, relative to some minimum number of processors.
This minimum may vary from machine to machine based on node memory limits for
the individual system, or to avoid the appearance of superlinear scaling. This can occur when the benchmark code
does not fit well into memory on a small number of processors but nevertheless
runs slowly using virtual memory; cache problems on small numbers of processors
may also cause superlinear scaling.
|
SYSTEM (by date of benchmark) |
P |
|
P |
|
|
|
|
|
|
Scaling |
|
CAS 1.3
GHz Itanium2 (2/2004) |
4 |
to |
512 |
( |
2407 |
to |
116732 |
|
Mflop/sec
), |
38% |
|
|
4 |
to |
256 |
( |
2407 |
to |
79922 |
|
Mflop/sec
), |
52% |
|
|
4 |
to |
128 |
( |
2407 |
to |
48932 |
|
Mflop/sec
), |
64% |
|
|
4 |
to |
64 |
( |
2407 |
to |
28543 |
|
Mflop/sec
), |
74% |
|
|
4 |
to |
16 |
( |
2407 |
to |
8413 |
|
Mflop/sec
), |
87% |
|
|
4 |
to |
8 |
( |
2407 |
to |
4674 |
|
Mflop/sec
), |
97% |
|
SGI Altix
1.5 GHz (2/2004) |
1 |
to |
64 |
( |
1032 |
to |
47678 |
|
Mflop/sec
), |
72% |
|
|
1 |
to |
56 |
( |
1032 |
to |
44633 |
|
Mflop/sec
), |
77% |
|
|
1 |
to |
48 |
( |
1032 |
to |
39726 |
|
Mflop/sec
), |
80% |
|
|
1 |
to |
40 |
( |
1032 |
to |
33379 |
|
Mflop/sec
), |
81% |
|
|
1 |
to |
32 |
( |
1032 |
to |
27377 |
|
Mflop/sec
), |
83% |
|
|
1 |
to |
24 |
( |
1032 |
to |
20672 |
|
Mflop/sec
), |
83% |
|
|
1 |
to |
16 |
( |
1032 |
to |
14389 |
|
Mflop/sec
), |
87% |
|
|
1 |
to |
8 |
( |
1032 |
to |
7354 |
|
Mflop/sec
), |
89% |
|
|
1 |
to |
4 |
( |
1032 |
to |
3735 |
|
Mflop/sec
), |
90% |
|
|
1 |
to |
2 |
( |
1032 |
to |
1901 |
|
Mflop/sec
), |
92% |
|
HP
Superdome IA-64 1.5 GHz (2/2004) |
1 |
to |
64 |
( |
1218 |
to |
52782 |
|
Mflop/sec
), |
68% |
|
|
1 |
to |
32 |
( |
1218 |
to |
25388 |
|
Mflop/sec
), |
65% |
|
|
1 |
to |
16 |
( |
1218 |
to |
13872 |
|
Mflop/sec
), |
71% |
|
|
1 |
to |
8 |
( |
1218 |
to |
7000 |
|
Mflop/sec
), |
72% |
|
|
1 |
to |
4 |
( |
1218 |
to |
3582 |
|
Mflop/sec
), |
74% |
|
|
1 |
to |
2 |
( |
1218 |
to |
2188 |
|
Mflop/sec
), |
90% |
|
HP XC
3000, 2.8 GHz Xeon (11/2003) |
2 |
to |
240 |
( |
991 |
to |
60604 |
|
Mflop/sec
), |
51% |
|
|
2 |
to |
192 |
( |
991 |
to |
51394 |
|
Mflop/sec
), |
54% |
|
|
2 |
to |
128 |
( |
991 |
to |
38452 |
|
Mflop/sec
), |
61% |
|
|
2 |
to |
120 |
( |
991 |
to |
37940 |
|
Mflop/sec
), |
64% |
|
|
2 |
to |
64 |
( |
991 |
to |
21634 |
|
Mflop/sec
), |
68% |
|
|
2 |
to |
32 |
( |
991 |
to |
13123 |
|
Mflop/sec
), |
83% |
|
|
2 |
to |
16 |
( |
991 |
to |
7230 |
|
Mflop/sec
), |
91% |
|
|
2 |
to |
8 |
( |
991 |
to |
3753 |
|
Mflop/sec
), |
95% |
|
|
2 |
to |
4 |
( |
991 |
to |
1944 |
|
Mflop/sec
), |
98% |
|
Cray X1, SSPs
(9/23/2003) |
8 |
to |
384 |
( |
6587 |
to |
102465 |
|
Mflop/sec
), |
32% |
|
|
8 |
to |
192 |
( |
6587 |
to |
82112 |
|
Mflop/sec
), |
52% |
|
|
8 |
to |
96 |
( |
6587 |
to |
48340 |
|
Mflop/sec
), |
61% |
|
|
8 |
to |
64 |
( |
6587 |
to |
36328 |
|
Mflop/sec
), |
69% |
|
|
8 |
to |
32 |
( |
6587 |
to |
21218 |
|
Mflop/sec
), |
81% |
|
|
8 |
to |
16 |
( |
6587 |
to |
11472 |
|
Mflop/sec
), |
87% |
|
IBM P690
1.3 GHz (10/2003) |
1 |
to |
512 |
( |
791 |
to |
95907 |
|
Mflop/sec
), |
24% |
|
|
1 |
to |
256 |
( |
791 |
to |
70520 |
|
Mflop/sec
), |
35% |
|
|
1 |
to |
128 |
( |
791 |
to |
47953 |
|
Mflop/sec
), |
47% |
|
|
1 |
to |
64 |
( |
791 |
to |
29240 |
|
Mflop/sec
), |
58% |
|
|
1 |
to |
32 |
( |
791 |
to |
17005 |
|
Mflop/sec
), |
67% |
|
|
1 |
to |
16 |
( |
791 |
to |
9014 |
|
Mflop/sec
), |
71% |
|
|
1 |
to |
8 |
( |
791 |
to |
4863 |
|
Mflop/sec
), |
77% |
|
|
1 |
to |
4 |
( |
791 |
to |
2808 |
|
Mflop/sec
), |
89% |
|
|
1 |
to |
2 |
( |
791 |
to |
1539 |
|
Mflop/sec
), |
97% |
|
IBM
P655+ 1.7 GHz (10/2003) |
1 |
to |
64 |
( |
1704 |
to |
45239 |
|
Mflop/sec
), |
41% |
|
|
1 |
to |
32 |
( |
1704 |
to |
26641 |
|
Mflop/sec
), |
49% |
|
|
1 |
to |
16 |
( |
1704 |
to |
14620 |
|
Mflop/sec
), |
54% |
|
|
1 |
to |
8 |
( |
1704 |
to |
7710 |
|
Mflop/sec
), |
57% |
|
|
1 |
to |
4 |
( |
1704 |
to |
3970 |
|
Mflop/sec
), |
58% |
|
|
1 |
to |
2 |
( |
1704 |
to |
2098 |
|
Mflop/sec
), |
62% |
|
Xeon 2.4
GHz, Myrinet, IFC, (2/2003) |
4 |
to |
336 |
( |
1541 |
to |
58480 |
|
Mflop/sec
), |
45% |
|
|
4 |
to |
256 |
( |
1541 |
to |
49951 |
|
Mflop/sec
), |
51% |
|
|
4 |
to |
128 |
( |
1541 |
to |
30350 |
|
Mflop/sec
), |
62% |
|
|
4 |
to |
64 |
( |
1541 |
to |
18028 |
|
Mflop/sec
), |
73% |
|
|
4 |
to |
32 |
( |
1541 |
to |
10203 |
|
Mflop/sec
), |
83% |
|
|
4 |
to |
16 |
( |
1541 |
to |
5235 |
|
Mflop/sec
), |
85% |
|
|
4 |
to |
8 |
( |
1541 |
to |
2928 |
|
Mflop/sec
), |
95% |
|
Xeon 2.2
GHz, Myrinet, IFC (11/2002) |
2 |
to |
256 |
( |
596 |
to |
39242 |
|
Mflop/sec
), |
51% |
|
|
2 |
to |
128 |
( |
596 |
to |
26204 |
|
Mflop/sec
), |
69% |
|
|
2 |
to |
64 |
( |
596 |
to |
14272 |
|
Mflop/sec
), |
75% |
|
|
2 |
to |
32 |
( |
596 |
to |
8443 |
|
Mflop/sec
), |
89% |
|
|
2 |
to |
16 |
( |
596 |
to |
4229 |
|
Mflop/sec
), |
89% |
|
Pittsburgh
SC TCS (11/26/2001) |
1 |
to |
512 |
( |
586 |
to |
105923 |
|
Mflop/sec
), |
35% |
|
|
1 |
to |
256 |
( |
586 |
to |
74346 |
|
Mflop/sec
), |
50% |
|
|
1 |
to |
128 |
( |
586 |
to |
49252 |
|
Mflop/sec
), |
66% |
|
|
1 |
to |
64 |
( |
586 |
to |
29119 |
|
Mflop/sec
), |
78% |
|
|
1 |
to |
32 |
( |
586 |
to |
16063 |
|
Mflop/sec
), |
86% |
|
|
1 |
to |
4 |
( |
586 |
to |
2038 |
|
Mflop/sec
), |
87% |
|
Fujitsu VPP
5000 (8/9/2000) |
1 |
to |
40 |
( |
2156 |
to |
40638 |
|
Mflop/sec
), |
47% |
|
|
1 |
to |
20 |
( |
2156 |
to |
27815 |
|
Mflop/sec
), |
65% |
|
|
1 |
to |
10 |
( |
2156 |
to |
16650 |
|
Mflop/sec
), |
77% |
John Michalakes, michalak@ucar.edu
---
New page: March 4, 2004
Updated, March 9, 2004; added CAS Itanium2 results.