To test the ability of a model
to accurately simulate
vertically propagating linear hydrostatic mountain waves, we examine
the case
of an atmosphere with a constant mean wind speed, U, with height and an isothermal
stratification. We assume a dry atmosphere
with no
rotation. The perturbations are
assumed to vanish in the far field. Applying
a linearized bottom boundary
condition and a radiation upper
boundary condition, the analytic solution in two dimensions for the
steady
state displacement streamlines obtained following Alaka (1960) and
Durran and
Klemp (1982) is
 ,
(1)
,
(1)
where  is the basic
state density, hm
is the
mountain height, a is
the
mountain half width, and l is the
Scorer parameter, which is defined as the following for an isothermal
atmosphere (Durran and Klemp 1982)
 ,
,
where T is the
temperature, R is the
dry
constant, and Cp the
specific heat at constant pressure. The
mountain profile, h(x), is a witch of
Agnesi curve,
 .
.
The vertical velocity can be
obtained from
w=Udx.
(2)
The
analytic solution for the vertical velocity computed from (1) and (2)
for an
atmosphere with T=250K, U=20 m s-1, a=10 km and hm=1
m is
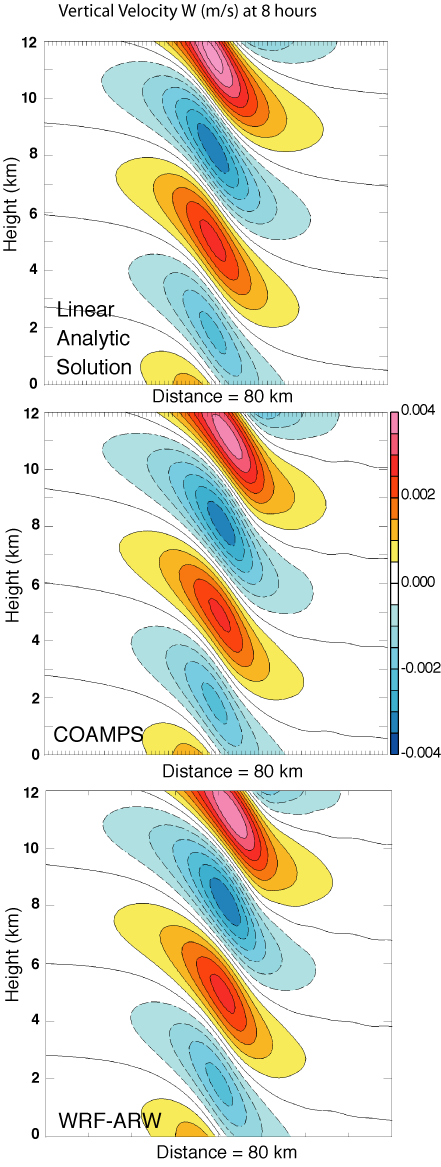
shown in Fig. 1a. As an example
from two numerical models, the steady state vertical velocity obtained
from the
atmospheric portion of the Coupled Ocean-Atmosphere Mesoscale
Prediction System
(COAMPS; Hodur 1997) and the WRF-ARW is shown in Figs.
1b and 1c
for Ut/a=30 or t=15,000 s. At the COAMPS
model top, a radiation boundary condition is used to mitigate the
reflection of
waves following Klemp and Durran (1983) and Bougeault (1983) while in
WRF-ARW a
Rayleigh damping sponge layer is used. In
this application, the finite difference
schemes are of second-order
accuracy in time and space for COAMPS and third-order in time and
fifth-order
in space for WRF. The domains
consists of 41x121 points (80x30 km) with grid intervals of Dx=2 km and Dz=250
m. In both models, the
compressible equations are integrated efficiently using a time
splitting
technique through the use of a semi-implicit formulation for the
vertical
acoustic modes (Klemp and Wilhelmson, 1978; Skamarock and Klemp 1994). The small mountain height of 1 m,
assures that the nonlinear contributions can be ignored.
The nonhydrostatic contribution is
minimal as well because Na/U>>1.

Figure 1.
Vertical velocity obtained for the a)
steady-state linear analytic
solution, b) COAMPS, and c) WRF-ARW simulations at Ut/a=30 or t=15,000
s. The vertical velocity contour and color
shading interval is 5x10⁻⁴ m s-1.
The
vertical flux of horizontal momentum is an additional test of the
ability of the
model to accurately simulate the properties of vertically propagating
linear
hydrostatic mountain waves. The
vertical flux of horizontal momentum, defined as
 ,
,
where u’ and w’ are deviations
from the basic state of the
horizontal and vertical velocity, respectively. The
vertical flux of horizontal momentum for linear
hydrostatic waves is constant with height (e.g., Eliassen and Palm
1960; Smith
1979)
 ,
(3)
,
(3)
where N is the
Brunt-Väisälä frequency, which for an
isothermal atmosphere can be expressed as,
 .
.
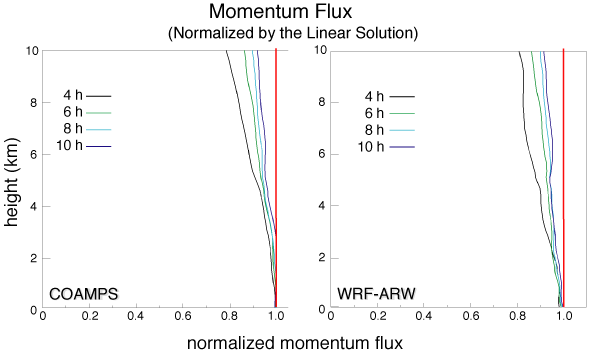
The simulated vertical flux of
horizontal momentum normalized
by the linear flux (3) is shown in Figs. 2a and b for both COAMPS and
WRF-ARW,
respectively, for the 4, 6, 8, 10 h simulation times corresponding to
the
Ut/a=29, 43, 58, 72 nondimensional times. The
model-simulated vertical momentum flux
reach a range between 0.95
and 1.0, particularly up to a height of one vertical wavelength,
Nz/U=6.4
km. These results are similar in
accuracy as a number of other models such as Durran and Klemp (1983)
and Xue
and Thorpe (1991). Additional, the
evolution of the model simulated surface pressure drag should be
compared with
the linear drag for a bell shaped mountain, D=prNUhm2/4, as discussed by Durran and Klemp
(1983).

Figure 2.
Vertical profiles of vertical flux
ofhorizontal momentum for a) COAMPS
and b) WRF. The vertical fluxes
are normalized by the linear values. The
profiles correspond to the 4, 6, 8, 10 h
simulation times or
nondimensional times, Ut/a=29, 43, 58, 72 and denoted by the black,
green,
turquoise, and blue colors, respectively.
This
numerical experiment is a robust test for the numerical implementation
of model
equations including the bottom and top boundary conditions, terrain
transformation, and formulation of the vertical velocity and pressure
or
density predictive equations in nonhydrostatic models.
Since the model terrain height is small
in order to minimize the nonlinear effects, the topographic
perturbations are
small making this experiment sensitive to truncation errors and
computational
precision issues. The vertical
fluxes are calculated from second order quantities and as a result the
momentum
flux is particularly sensitive to errors in the velocity fields, while
energy
flux may suffer from inaccuracies in both the vertical velocity and
mass
field. In the example shown in
Figs. 1 and 2, the numerically simulated linear hydrostatic mountain
waves and
associated vertical fluxes of momentum and energy are in very good
agreement
with the analytic solution. The
mountain waves in this test case are well resolved and should be
relatively
insensitive to artificial damping and numerical dissipation.
________________________________________________________
2. Linear
Nonhydrostatic Mountain Waves
Purpose: This
experiment will test the model
ability to simulate small-amplitude nonhydrostatic topographic flows. When the parameter Na/U is
approximately unity, both hydrostatic and nonhydrostatic wave
components may be
present. The nonhydrostatic waves
have a group velocity that is directed with a more downstream component. The test specifically is designed to
assess the accuracy of the nonhydrostatic formulation of the model
dynamical
equations including the nonhydrostatic solver. The
solutions are also sensitive to the lower and upper
boundary conditions and to some degree the lateral boundary conditions
because
of the downstream dispersion of wave energy.
Analytic
Solution: A
linear solution is obtained from the two-dimensional hydrostatic
equations of
linear mountain wave theory for following Smith (1980).
The linearized equations for the
horizontal velocity, vertical velocity, and pressure perturbation are
reduced to
a single equation for the vertical displacement, h (x, y, z). A
Fourier Transform is used from (x, y) to
(k, l)
coordinates so that the equation for the transformed vertical
displacement  (k,
l, z) becomes
 ,
(1)
,
(1)
where s is
the intrinsic frequency such that s=Uk+Vl. The
solution to a multi-layer system,
which contain constant wind and stability (i=1, 2, 3) is
 ,
(2)
,
(2)
where
the
vertical wavenumber is given by m2=(k2+l2)(Ni2-s)/si2
and Ai and Bi are the amplitude coefficients for
the
upward and downward propagating waves, respectively.
A radiation condition is applied at the top
boundary. In this application, a single
layer
with constant stratification of N=0.01 s-1 and U=10 m s-1
is considered. A witch of Agnesi
terrain shape with a half-width of 1 km implying Na/U=1.
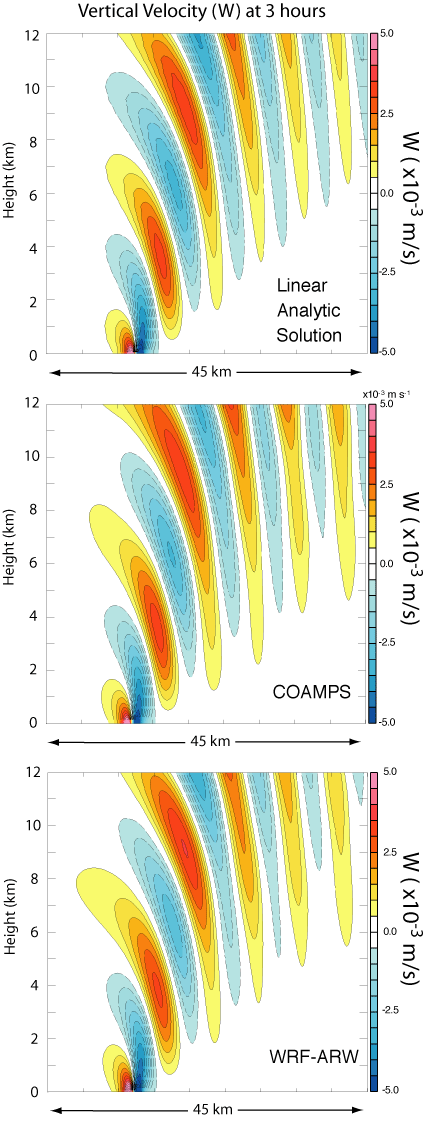
The analytical solution results for
vertical velocity are shown in Fig. 1a.
Model
Setup: The
COAMPS and WRF-ARW models are initialized with uniform stratification
of N=0.01
s-1 and U=10 m s-1 and a=2 km.
A domain consisting of 360x120 points with Dx=400 m and Dz=250
m. A Rayleigh damping layer is
used in the top 40 layers.

Figure
1. Analytic solution of vertical velocity
(contour interval 6x10⁻⁴ m s-1) (upper right) for
the
linear nonhydrostatic test case. COAMPS
(lower left) and WRF-ARW (lower right) simulations of vertical velocity
(contour interval 6x10⁻⁴ m s-1) after Ut/a=45 or
9000 s.


