

|
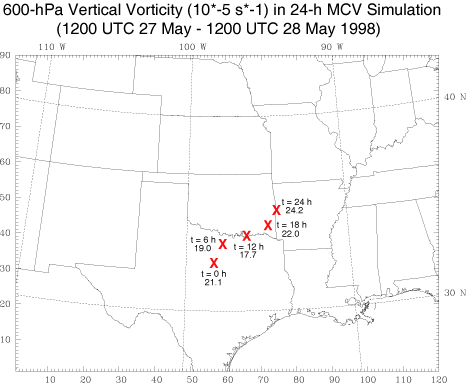
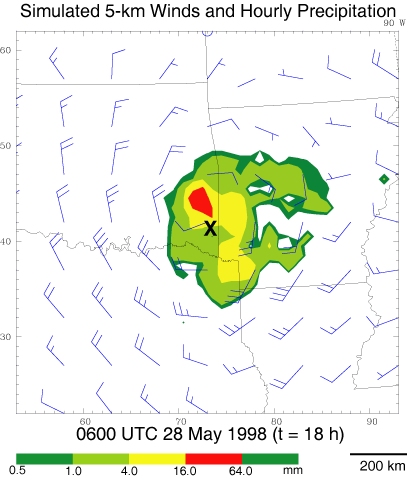
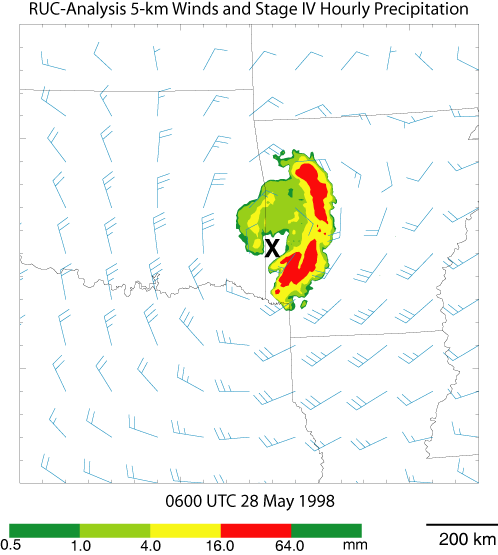
A 24-h simulation of a convectively generated mesoscale vortex (MCV) that was responsible for heavy rainfall over portions of the southern Great Plains during 27-28 May 1998 was performed. This simulation employed 20-km horizontal grid spacing and utilized the Kain-Fritsch cumulus (cu_physics = 1), MRF boundary layer (bl_pbl_physics = 1), and six-class Lin microphysical (mp_physics = 2) parameterizations. Both this simulation and observations reported by Trier and Davis (Monthly Weather Review, 2002, 877-899) revealed the persistence of the midtopospheric vortex and its close association with subsequent outbreaks of convection. The model horizontal domain and the track of the simulated 600-hPa vortex are shown in FIG. 1. Both the position and strength of the midtropospheric circulation after 18 h of simulation (FIGURE 2) are similar to that diagnosed from RUC model analyses (FIGURE 3) and other sources of observations (Trier et al., Monthly Weather Review, 2000, 3376-3395). Heavy precipitation occurs overnight near and slightly downshear of the vortex center in both the simulation (FIGURE 2) and the observations (FIGURE 3). Although there is a close correspondence between the simulation and observations on the general location of heavy precipitation, the control simulation discussed here consistently underestimates maximum observed precipitation intensity. This differs from nested grid simulations performed by Davis and Trier (Monthly Weather Review, 2003, In Press), wherein deep convection in the vicinity of the vortex was explicitly resolved. Click here to download this dataset. |
|
|
|