1. Background
For
years NCAR’s Mesoscale and Microscale Meteorology (MMM) Laboratory, which
supports the WRF Model to the community, has run WRF for real-time forecasting
focused on convective weather over the CONUS.
In this it has configured WRF with a particular combination of physics
options, i.e., a physics suite. This combination
has been reliable and accurate and is now offered as the “NCAR
convection-permitting suite”. It consists
of the following schemes.
•
Thompson
microphysics scheme (Thompson
et al. 2008)
•
MYJ
PBL scheme (Janjic 1994)
•
Noah
LSM (Chen
et al. 1997)
•
RRTMG
shortwave radiation scheme (Iacono et al. 2008)
•
RRTMG
longwave radiation scheme (Iacono et al. 2008)
•
Tiedtke cumulus scheme (Tiedtke 1989, Zhang et
al. 2011)
•
MYJ surface layer scheme (Janjic 1994)
Note
that while the suite has been used for convection-permitting forecasting in
fully-explicit mode with a cumulus parameterization not activated, it does
include a cumulus scheme for completeness and for applications with coarser
grids. An example is given below with the
NCAR ensemble prediction system which involves both 15-km and 3-km grids.
The
NCAR convection-permitting physics suite is documented here with references on
its schemes, some history of its use in MMM WRF forecasting, and recent testing
results. As illustrated, the suite has
been used reliably for years in various settings in MMM. For WRF forecasting applications focused on
mid-latitude, continental convection, it has been found to be skillful and
robust.
2. History of
Suite Use and Applications
a. NCAR Real-Time
Forecasting
MMM
began experimenting with real-time WRF forecasting in a convection-permitting
mode in 2003 in the BAMEX (The Bow Echo and Mesoscale Convective Vortex
Experiment) field campaign (Done et al. 2004) and has continued since. Along the way there has been regular
evaluation (both published and internal) of the forecasts reflecting the chosen
physics configurations. Weisman et al.
(2008) assessed such real-time WRF forecasts and analyzed the physics scheme
performance. With respect to packages in
the convection-permitting suite, they found that compared to the YSU PBL
scheme, the MYJ PBL scheme consistently produced a cooler, moister boundary
layer, which was more favorable for convection initiation. And, the Thompson microphysics scheme tended
to more accurately represent the stratiform regions
behind squall lines than other options.
From
such yearly exercises and evaluations, the favored set of physics packages for
applying WRF with convection-permitting grids has evolved. By 2008, the MMM WRF suite had settled into
the Noah LSM, MYJ PBL, Thompson microphysics, RRTM longwave radiation, and
Goddard shortwave radiation options. In
2012, the radiation schemes in the real-time configuration were updated to
RRTMG, defining the current convection-permitting suite.
Since
2007 MMM has participated in the annual Spring Forecasting Experiment (SFE) organized
by NOAA’s Storm Prediction Center (SPC) and NSSL by contributing real-time WRF
forecasts to the model guidance pool. This
has allowed for a long-term examination of WRF, and its performance with the
basic suite, by forecasters and scientists.
As an example from this setting, Coniglio et
al. (2010) evaluated the forecasts from different configurations of WRF run by
2008 SFE modeling groups at convection-allowing scales (viz., 4-km and 3-km
grids) and found that they outperformed the coarser, operational model
forecasts with which they were compared in precipitation forecasts. While they found a cold bias in surface and
lower tropospheric temperatures and less-than-observed vertical wind shear and
850-mb moisture over the high plains in all the WRF runs, they suggested that
the errors may be linked to the PBL parameterization and the lack of a shallow
convection parameterization in the configurations considered. Similarly, Schwartz et al. (2010) examined a
number of WRF physics scheme combinations in convection-permitting forecasts
from 2007, finding differences in precipitation biases, but with the MYJ and
Thompson scheme pair showing reasonable biases for low-to-moderate accumulation
thresholds. Romine et al. (2013) further
evaluated model physics choices in a continuously-cycled data assimilation
system and showed that the set in the NCAR convection-permitting suite
generally performed well.
b. NCAR Ensemble
Prediction System
As
described above, the suite options have been used in WRF setups for real-time
forecasting by MMM, in large part in support of the annual Spring Forecasting Experiment,
which has had a focus on prediction of convection in the central U.S. In addition, in recent years the physics
suite has also been heavily used by MMM in its real-time, convection-allowing
ensemble prediction system (EPS). The
EPS’s configuration, operation, and performance have been documented in a
number of publications (see below). The system
has two WRF components, one for analysis and one for forecasting, both of which
use the suite. The analysis component employs
continuously-cycled ensemble adjustment Kalman filter
(EAKF) data assimilation with 15-km horizontal grid spacing to produce analyses
that initialize the forecast component’s high-resolution (3-km) ensemble
predictions. The physics suite is used
in both parts, except the cumulus parameterization is turned off in the 3-km forecast
component.
The
suite has a history in EPS settings, such as its use in WRF in field campaigns
(such as the Mesoscale Predictability Experiment (MPEX; 2013) (Schwartz et al.
2015a) and the Deep Convective Clouds and Chemistry Experiment (DC3; 2012)
(Romine et al. 2014)) and (for ensembles for 2015–2017) the Spring Forecasting
Experiment (Clark et al. 2012). In
addition to such applications, the EPS has been run for ongoing real-time WRF
forecasting in MMM (Schwartz et al. (2015b); http://ensemble.ucar.edu). In these EPS settings, the suite has
demonstrated an ability to capture the evolutions and structures of organized
convective storms (see, e.g., Powers et al. (2017), Fig. 3).
Schwartz
et al. (2015a) first documented the convection-allowing EPS employing the
suite, examining forecasts from MPEX over the central U.S. While the WRF forecasts had a positive bias
for rainfall (i.e., slight overprediction was seen
for the suite and the ensemble setup), in comparisons with NCEP Stage IV
observations, the (spatial) patterns of model precipitation demonstrated skill. Overall, they found that the WRF configuration
produced severe weather forecasts that were good based on subjective
evaluations and objective statistics, despite noting some errors in convective
timing and location.
Expanding
on their initial work, Schwartz et al. (2015b) further demonstrated the skill
of the WRF EPS using the suite in forecasting precipitation and in providing
severe weather guidance. Evaluating system
forecasts for a 3-month period, they found that WRF in general correctly located
precipitation and forecast reasonable amplitudes, although there was some overprediction for precipitation rates above 5.0 mm/hr and some underprediction for lower
rates. Regarding the simulation of
convective structures, WRF using the suite was found to provide valuable
guidance in strongly-forced MCS events, with lesser skill for weakly-forced
events.
3. Recent Suite Testing
While
the suite has a track record of use at NCAR, MMM has also done some targeted
testing of the suite. This primarily reflects
runs using a convection-permitting grid over a spring period (May–June
2016). For this, WRF V3.9 was set up
with a 3-km grid (736 x 676 points) over the central U.S.
(Fig. 1),
with 40 vertical levels up to 30 mb. The
forecasts were initialized at 0000 UTC and 1200 UTC (using the GFS as a
first-guess) every three days for the period 17 May 2016 to 10 June 2016. This domain and period were selected mainly
because severe convective weather and substantial precipitation are common there
in this time frame.
In addition to this testing, a
single-case study of the WRF forecast sensitivity to microphysics scheme has
been performed. For this, one WRF run has
the suite as defined and employing the Thompson microphysics (Thompson et al.
2008), while three others have a different packages: P3 (Morrison and Milbrandt 2015),
Morrison (Morrison et al. 2009), and WSM6 (Hong and
Lim 2006). WRF is initialized
at 0000 UTC 26 May 2016, and the forecasts are for 48 hours. This case was selected because it involved
large amounts of rainfall over a broad area (and regionally some very heavy
rainfall).
From the seasonal testing, Fig. 2 compares
forecast precipitation from the May–June 2016
WRF suite runs with Stage IV observations.
The model output and Stage IV data are put on the same grid and the precipitation
accumulations compared. The upper left
and right panels show average gridpoint accumulations
for the 48 hours of the 0000 UTC (left) and 1200 UTC (right) forecast
initializations. After a spin-up period
of 6–12 hours in which WRF (expectedly) underforecasts
the precipitation, there is good agreement with the observations for both
initialization times. Note that model
performance (for precipitation) is better in the first 30 forecast hours for
the 1200 UTC initializations than for the 0000 UTC initializations. This may reflect the fact that the diurnal
cycle (the precipitation signal of which is also seen in Fig. 2) has more
precipitation occurring near 0000 UTC, so the 0000 UTC run output will miss
more of this due to being earlier in the spin-up phase than that of the 1200
UTC runs. For both initializations, as
the lead time increases, the influence of initial condition wanes. Lastly, the bottom panel in Fig. 2 shows the
average gridpoint precipitation amount bias (model–observed),
with close-to-zero bias after the spin-up period.
The results from the case comparison
(26 May 2016) of the convective suite with its base (Thompson) microphysics
scheme and other microphysics schemes are presented in Figs. 3 and 4. Figure 3 shows the spatial distributions of
precipitation across the simulations for a 24-hour period after a model spin-up
period of 12 hours. Thus, the
accumulations correspond to hours 12–36 of the
forecasts (1200 UTC 26 May–1200 UTC 27 May 2016). The microphysics scheme for each run is noted
in the tops of the panels, with the Stage IV data in the bottom panel. The model patterns of accumulation overall are
consistent with the observations. However,
the center of heaviest precipitation in southeastern Texas along the Gulf Coast
is shifted northward relative to that observed in all the simulations except
the WSM6 experiment, where the center is located more inland compared to the observations.
Similarly, with the observed precipitation
center in the Midwest, the model counterpart is shifted northward relative to
the observations in all four experiments.
Figure 4 shows the bias and
fractions skill score (FSS) metrics for the 24-hr period examined above. The FSS neighborhood was set at 60 km. The Thompson microphysics selection of the
suite generally shows better bias and FSS scores than the P3 scheme, but not as
good as Morrison and WSM6. All four
schemes perform better for lighter precipitation. For heavy precipitation, the convective suite’s
Thompson scheme underestimates the frequency, while the other three schemes
overestimate it.
Note that these microphysics
comparison results are for a single case for which the Stage IV observations
indicate local precipitation (in eastern Texas) was up to 452.9 mm/24 hr for the 1200 UTC
26 May–1200 UTC 27 May period.
It is recognized that such heavy rainfall makes for a forecast challenge
for WRF. However, the microphysics scheme
comparison was done to provide some basic indication of the performance of the
target suite relative to variations of it, and an exhaustive inter-scheme
comparison is not the purpose here. Systematic
experiments of various cases/scenarios would be necessary to provide a
comprehensive picture of the relative performance of the different microphysics
schemes within the convection-permitting suite.
Figures
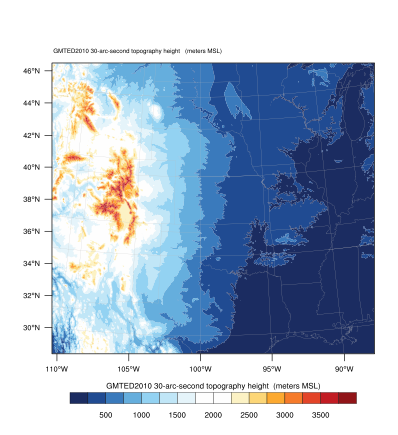
Fig.
1: WRF domain used for testing of suite for Spring 2016 period. Grid spacing: 3 km. Terrain shaded (m, MSL); scale at bottom.
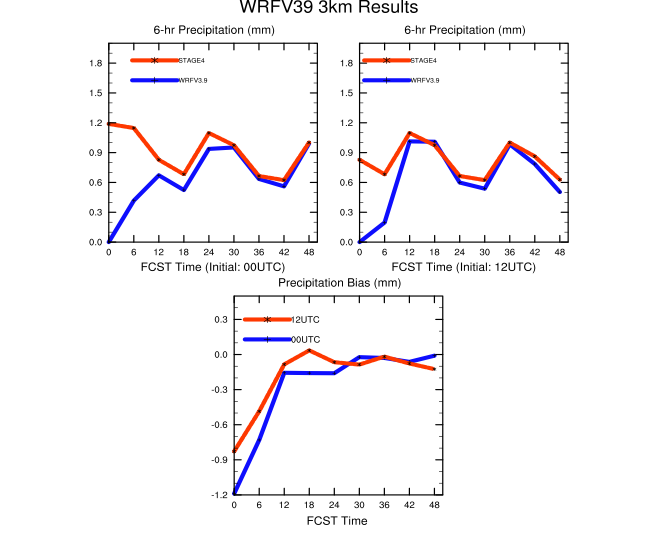
Fig.
2: Comparisons of WRF suite test period runs (red) with Stage IV precipitation
observations (blue) across forecast hours 0–48. Upper left panel: Average gridpoint
accumulation (mm) across model domain for forecasts initialized at 0000
UTC. Upper right panel: Average gridpoint accumulation (mm) across model domain for
forecasts initialized at 1200 UTC.
Bottom panel: Difference (mm) of average gridpoint
accumulations for WRF suite runs (red) and Stage IV observations (blue).
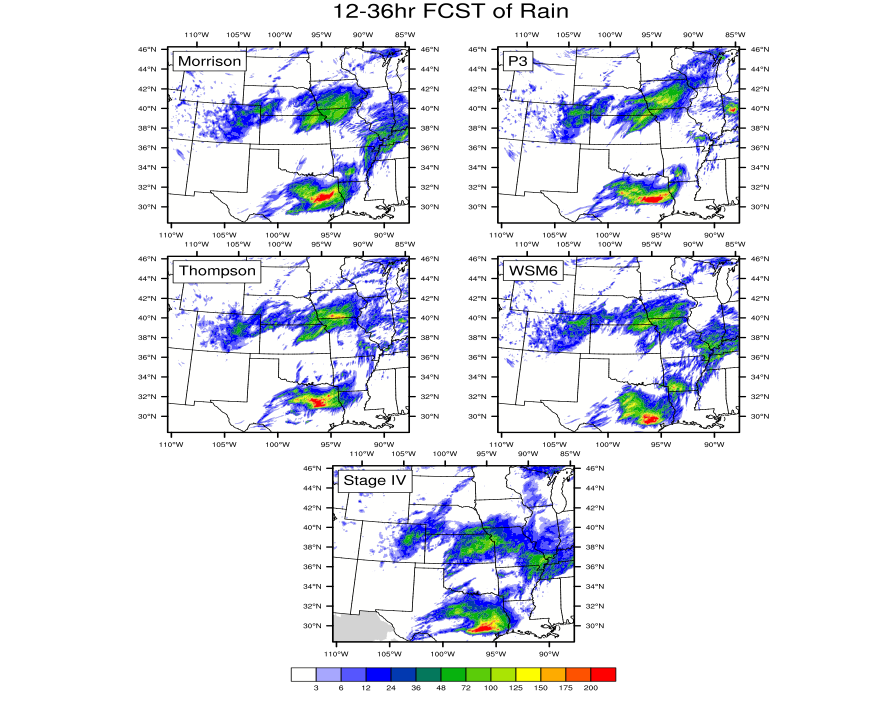
Fig. 3: 24-hr accumulations of
precipitation from WRF runs for case of 26 May 2016. Period plotted: forecast hours 12–36,
1200 UTC 26 May–1200 UTC 27 May 2016.
Stage IV analysis for the period shown in bottom panel. Precipitation amounts in mm/24 hr, scale at bottom.
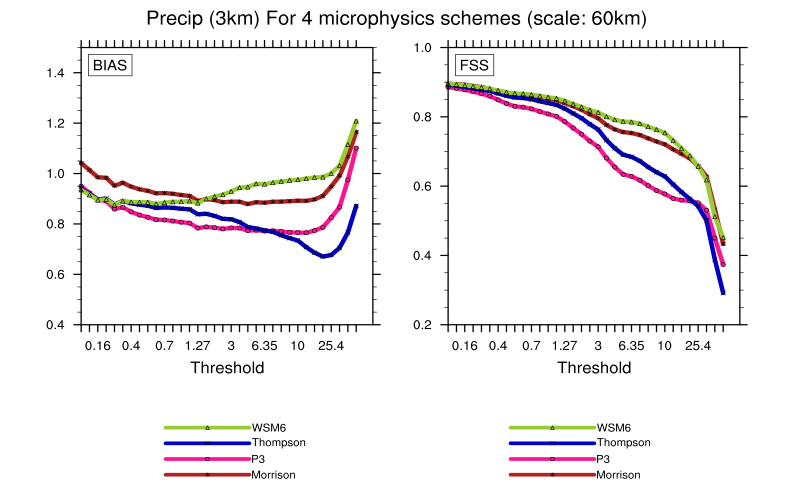
Fig. 4: Bias (left) and fractions
skill score (FSS) (right) metrics for the 24-hr forecast period from WRF runs
for the case of 26 May 2016. Period
plotted: forecast hours 12–36, 1200 UTC 26 May–1200
UTC 27 May 2016. The FSS neighborhood
was set at 60 km.
References
Chen,
F., Z. Janjic, K. Mitchell, 1997: Impact of
atmospheric surface layer parameterization in the new land-surface scheme of
the NCEP Mesoscale Eta numerical model. Bound.-Layer Meteor., 185,
391–421.
Clark,
A. J., and Coauthors, 2012: An Overview of the 2010 Hazardous Weather Testbed
Experimental
Forecast Program Spring Experiment. Bull. Amer. Meteor. Soc., 93, 55–74.
doi:10.1175/BAMS-D-11-00040.1
Coniglio, M.C., K.L.
Elmore, J.S. Kain, S.J. Weiss, M. Xue
and Weisman, M. L., 2010: Evaluation of WRF model output for severe weather
forecasting from the 2008 NOAA Hazardous Weather Testbed Spring Experiment. Wea. Forecasting, 25, 408–427. doi: 10.1175/2009WAF2222258.1
Done,
J., C. A. Davis, and M. L. Weisman, 2004: The next generation of NWP: Explicit
forecasts of convection using the Weather Research and Forecast (WRF) model. Atmos.
Sci. Lett., 5, 110–117.
doi:10.1002/asl.72.
Hong,
S.–Y., and J.–O. J. Lim, 2006: The WRF single–moment 6–class microphysics
scheme (WSM6). J. Korean
Meteor. Soc., 42,
129–151.
Iacono, M. J., J. S. Delamere, E.
J. Mlawer, M. W. Shephard, S. A. Clough, and W. D.
Collins, 2008: Radiative forcing by long-lived greenhouse gasses: Calculations
with the AER radiative transfer models. J. Geophys. Res.,
113, D13103. doi: 10.1029/2008JD009944.
Janjic, Z., 1994: The step-mountain eta coordinate model:
Further developments of the convection, viscous sublayer, and turbulence
closure schemes. Mon. Wea.
Rev., 122, 927–945.
Morrison,
H., G. Thompson, and V. Tatarskii, 2009: Impact of
cloud microphysics on the development of trailing stratiform
precipitation in a simulated squall line: Comparison of one– and two–moment
schemes. Mon. Wea. Rev., 137,
991–1007.
Morrison, H., and J. Milbrandt,
2015: Parameterization of cloud
microphysics based on the prediction of bulk ice particle properties. Part I:
Scheme description and idealized tests. J. Atmos. Sci., 72, 287–311.
Powers,
J. G., and Co-Authors, 2017: The Weather Research and Forecasting Model: Overview,
System Efforts, and Future Directions. Bull. Amer. Meteor. Soc., 98 (in press).
Romine,
G. S., C. S. Schwartz, C. Synder, J. L. Anderson, and
M. L. Weisman, 2013: Model bias in a continuously cycled assimilation system
and its influence on convection-permitting forecasts. Mon. Wea. Rev., 141,
1263–1284. doi:10.1175/MWR-D-12-00112.1
Romine,
G. S., C. S. Schwartz, J. Berner, K. R. Fossell, C. M. Snyder, J. L. Anderson, and M. L. Weisman,
2014: Representing forecast error in a convection-permitting ensemble
system. Mon. Wea. Rev., 142, 4519–4541.
doi:10.1175/MWR-D-14-00100.1
Schwartz,
C. S., J. S. Kain, S. J. Weiss, M. Xue, D. R. Bright, F. Kong, K. W. Thomas, J. J. Levit, M. C. Coniglio, and M. S. Wandishin, 2010: Toward improved convection-allowing
ensembles: Model physics sensitivity and optimizing probabilistic guidance with
small ensemble membership. Wea. Forecasting, 25, 263–280. doi:10.1175/2009WAF2222267.1
Schwartz,
C. S., G. S. Romine, M. L. Weisman, R. A. Sobash, K.
R. Fossell, K. W. Manning, and S. B. Trier, 2015a: A
real-time convection-allowing ensemble prediction system initialized by
mesoscale Ensemble Kalman Filter analyses. Wea. Forecasting, 30, 1158–1181. doi:10.1175/WAF-D-15-0013.1
Schwartz,
C. S., G. S. Romine, R. A. Sobash, K. R. Fossell, and M. L. Weisman, 2015b: NCAR’s experimental
real-time convection-allowing ensemble prediction system. Wea. Forecasting, 30, 1645–1654. doi:10.1175/WAF-D-15-0103.1
Thompson,
G., P. R. Field, R. M. Rasmussen, W. D. Hall, 2008: Explicit Forecasts of
Winter Precipitation Using an Improved Bulk Microphysics Scheme. Part II:
Implementation of a New Snow Parameterization. Mon. Wea.
Rev., 136,
5095–5115.
Tiedke, M., 1989: A
comprehensive mass flux scheme for cumulus parameterization in large-scale
models. Mon. Wea. Rev., 117, 1779–1800.
Weisman,
M. L., C. Davis, W. Wang, K. W. Manning, and J. B. Klemp,
2008: Experiences with 0-36-h explicit convective forecasts with the WRF-ARW
model. Wea. Forecasting, 23,
407–437. doi:10.1175/2007WAF2007005.1.
Zhang,
C., Y Wang, and K. Hamilton, 2011: Improved representation of boundary layer
clouds over the southeast Pacific in ARW-WRF using a modified Tiedtke cumulus parameterization scheme. Mon. Wea. Rev., 139,
3489–3513. doi:10.1175/MWR-D-10-05091.1.
