1. Background:
The WRF model currently has one physics suite, the ‘CONUS’
suite, which was approved by the Physics Review Panel in the Spring of 2017.
Here we propose to add a second physics suite to the model, the ‘tropical’
suite.
NCAR has been conducting tropical cyclone forecasts in real
time using the WRF model since 2003. These experimental forecasts were used to
evaluate the capability of the model in forecasting the track and intensity of
the tropical storms. From 2008 to 2012, NCAR joined the HFIP program from NOAA
and provided forecasts to the National Hurricane Center as part of the
experimental forecast product. The physics options used in these forecasts
evolved in time, and settled down during the HFIP experiment. It consists of a
modified Tiedtke convection scheme (Zhang et al. 2011), the RRTMG long- and
short-wave scheme, the WSM6 microphysics, the YonSei University PBL scheme, the
MM5 surface layer scheme and the Noah Land surface model. The early modeling
results were published in Davis et al. (MWR, 2008), and testing and evaluation
to switch cumulus convection scheme from Kain-Fritsch to Tiedtke was reported
in Torn and Davis (MWR, 2012).
In 2013 and 2014, this suite of physics was used in the
Model for Prediction Across Scales (MPAS), a global non-hydrostatic model, to
test that model's capability to forecast tropical cyclone in all three Northern
Hemispheric Basins. The tests showed the forecast track was comparable to that
from GFS. However, some issues were also found with this suite of physics in
the tropics, such as over-prediction of tropical rainfall, and large number of
false alarms for tropical cyclone genesis. The details of the evaluation can be
found in Davis et al. (2016).
Starting in 2015, we began to test the newer Tiedtke cumulus
scheme and found improvement. We've been using the suite with the newer Tiedtke
scheme (Zhang and Wang 2017) in the past four seasons. It is the testing
results from MPAS that is documented here. Since WRF and MPAS share many
similar characteristics in dynamics and numerics, we believe the test results
from MPAS can be extended to WRF, at least in the mesoscale range. Therefore
this suite is designated as "NCAR tropical suite" with the following
choices of physics:
- Tiedtke cumulus convection scheme (Zhang and Wang 2017)
- WSM6 microphysics (Hong and Lim 2006)
- RRTMG long- and short-wave radiation (Iacono et al. 2008)
- YSU PBL scheme (Hong et al. 2006)
- MM5 surface layer scheme (Zhang and Anthes, 1982)
- Noah land surface model (Chen and Dudhia, 2000)
This is also the first physics suite that is shared by both
WRF and MPAS models, and it is called the ‘mesoscale_reference’ suite in MPAS. In
addition to the tests done with MPAS, the contributors of the two Tiedtke
schemes from University of Hawaii (Zhang et al. 2011, Zhang and Wang 2017) have
tested this suite of physics in their regional climate work and found
satisfactory outcome.
2. Testing Results from MPAS
Figure 1 shows the mean track errors from July – Oct in 2016
(left) and 2017 (right) for Western Pacific Basin at 15 km model resolution.
The track forecast from MPAS using the tropical suite for up to 8-days of
leading time is comparable to that from GFS.
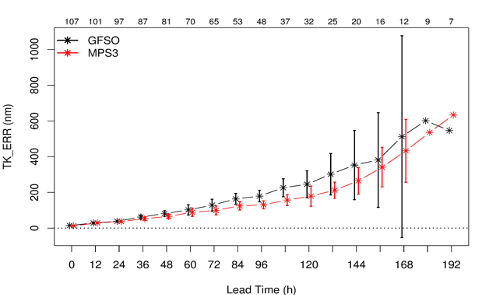
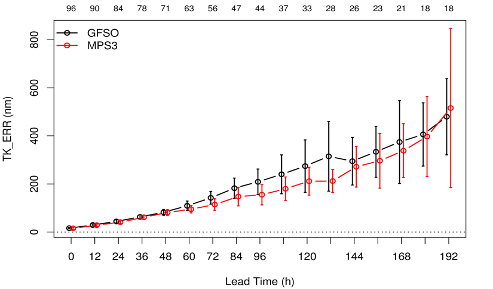
Figure
1: The mean track errors for all tropical storms from July to October in the
Western Pacific Basin in 2016 (top) and 2017 (bottom).
The mean track forecast for Atlantic Basin in 2017 is
presented in Fig. 2. Again, the track errors are comparable to that from GFS.
Larger forecast errors in one or two storms in day 7 and 8 of MPAS forecast
results in poorer performance in the late forecast period.
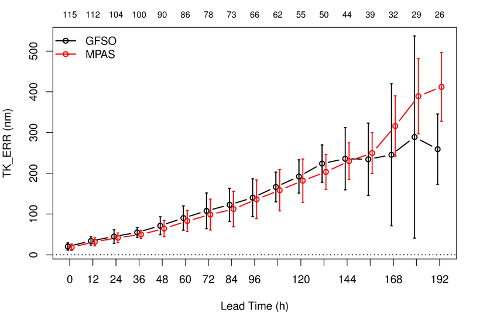
Figure
2: The mean track error for all tropical storms from July to October 2017 in
Atlantic Basin.
The model is also able to predict mean tropical rainfall
reasonably well. Figure 3 shows the monthly mean day-5 predicted rainfall from
MPAS and CMORPH for Sept 2017. The model is able to capture the overall
precipitation distribution and magnitude fairly well. There is an
over-prediction of rainfall over the Western Pacific, and under-prediction over
eastern Atlantic, however.
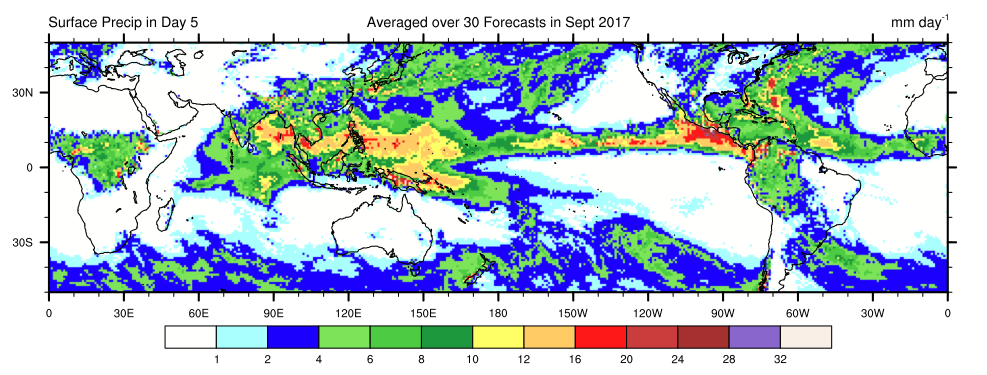
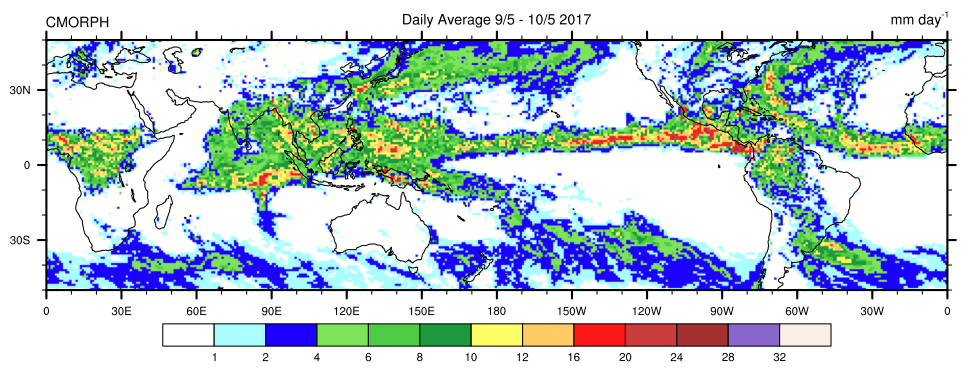
Figure
3: Monthly mean day-5 predicted rainfall (upper panel) and CMORPH for Sept
2017.
The model’s predicted anomaly correlation coefficient (ACC) is
also computed and it shows that the model has a reasonable skill in predicting
large-scale flows when compared from the same score from GFS (Fig. 4).
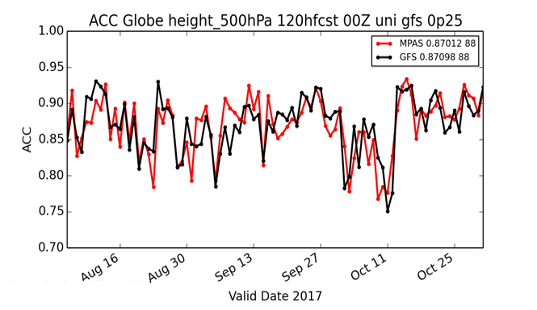
Figure
4: Daily ACC for 500 hPa geopotential height from August 1 to October 31, 2017.
The red line is the result from MPAS, and black from GFS.
More details about these testing and evaluation results can
be found in Wang et al. (2018).
3. References
Davis, A. C., et al. 2008: Prediction of Landfalling
Hurricanes with the Advanced Hurricane WRF Model. Mon. Wea. Rev., 136,
1990-2005.
Davis, A. C., D. Ahijevych, W. Wang, W. C. Skamarock, 2016:
Evaluating medium-range tropical cyclone forecasts in uniform- and
variable-resolution global models. Mon. Wea. Rev., 144, 4141-4160,
doi:10.1175/ MWR-D-16-0021.1.
Torn, R. D., and C. A. Davis, 2012: The influence of shallow
convection on tropical cyclone track forecasts. Mon. Wea. Rev., 140, 2188–2197,
doi:10.1175/MWR-D-11-00246.1.
Wang, W., D. Ahijevych, C. Davis, and B. Skamarock, 2018:
Performance of MPAS for tropical cyclone prediction in 2016 and 2017 seasons.
The 33rd Conferences of Hurricane and Tropical Meteorology, April
16-20, Ponte Vedra, Florida.
Zhang C., Wang Y, 2017: Projected future changes of tropical
cyclone activity over the western North and South Pacific in a 20-km- mesh
regional climate model. J. Clim. 30:5923–5941. https://doi.
org/10.1175/JCLI-D-16-0597.1.
WRF testing:
A case from August 25, 2014 was simulated using several
cumulus schemes in WRF 3.6.1. The grid resolution is 30 km, and the model
domain covers approximately 16650 km by 7350 km area over the Western Pacific
region. The following figure shows the day-3 precipitation from the simulations
using a modified Kain-Fritsch scheme for scale-awareness(middle plot) and the
Tiedtke scheme (bottom) over a sub-domain area. The top figure is the observed
precipitation from CMORPH.
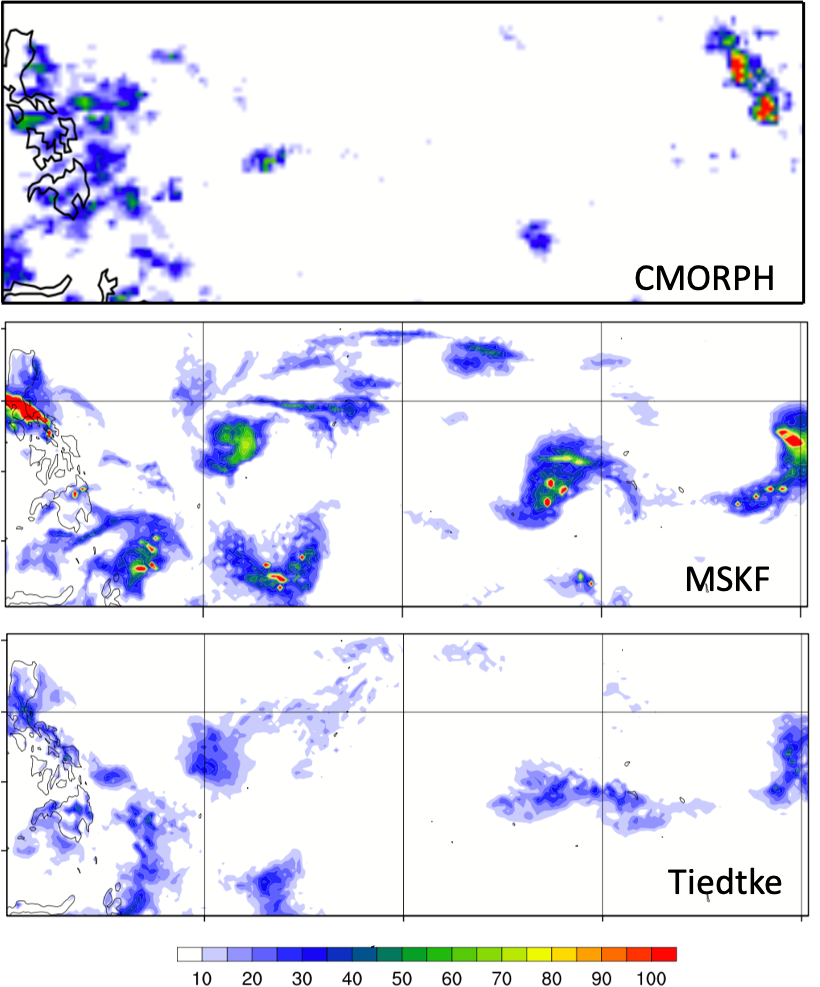
The simulated rainfall is significantly over estimated by
the Kain-Fritsch scheme in terms of area coverage (the bull-eyes from the
simulation are actually an artifact of the modification for the
scale-awareness). The precipitation from the Tiedtke run compares better with
the observed rainfall, though it may under-estimate the rainfall near the eastern
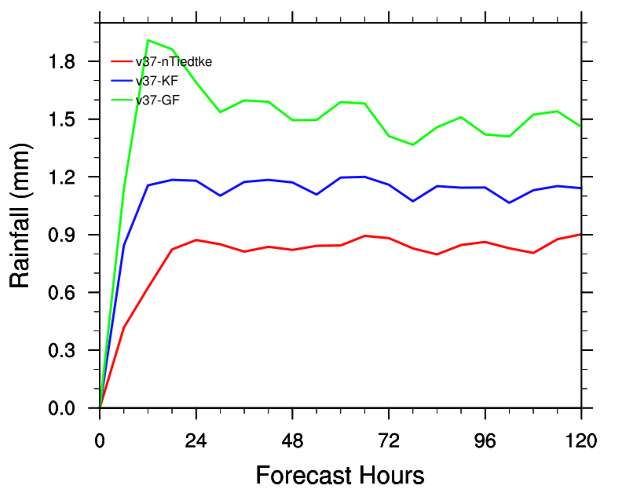
part of the sub-domain. The time series of the domain-averaged 6-hourly
precipitation from the new Tiedtke, Kain-Fritsch (not the scale-aware version)
and Grell-Freitas is presented in the next figure. It shows that rainfall
produced by the Kain-Fritsch and Grell-Freitas schemes may be excessive for
this case. The reduced precipitation over the tropical area by the new Tiedtke
scheme is consistent with what is seen in MPAS.
A comparison of the new Tiedtke scheme versus the old
Tiedtke, Kain-Fritsch and Betts-Miller-Janjic schemes in simulating tropical
cyclones can be found in a paper by Zhang and Wang (2018).
Reference:
Zhang, Chunxi, and Yuqing Wang, 2018: Why is the simulated
climatology of tropical cyclones so sensitive to the choice of cumulus
parameterization scheme in the WRF model? Climate Dynamics, 51, 3613—3633, https://doi.org/10.1007/s00382-018-4099-1.
