- Surface Conditions
- 2-m Temperature / 10-m Wind
- Ens Mean | Ens Max | Ens Min | Ens Spread | Postage Stamps
- 2-m Dewpoint / 10-m Wind
- Ens Mean | Ens Max | Ens Min | Ens Spread | Postage Stamps
- Misc.
- Ens Mean: 2-m RH
- Ens Spread: Mean Sea-level Pressure
- Postage Stamps: Equivalent Potential Temp. | 10-m wind | MSLP
- Precipitation
- 1-hr Precip
- Prob Matched Mean | Ensemble Max
- Neighbor Prob: > 0.01 in | > 0.25 in | > 0.5 in | > 1.0 in | > 2.0 in
- 6-hr Precip
- Ens Mean | Ensemble Max | Ensemble Min
- 12-hr Precip
- Ens Mean | Ensemble Max | Ensemble Min
- 24-hr Precip
- Ens Mean | Ensemble Max | Ensemble Min
- Accum. Precip
- Ens. Mean | Prob Matched Mean | Postage Stamps
- Neighbor Prob: > 1.0 in | > 2.0 in | > 3.0 in | > 6.0 in | > 10.0 in
- Reflectivity
- Ensemble Max: Comp Refl | 1 km AGL Refl
- Prob Match Mean: Comp Refl | 1 km AGL Refl
- Neighborhood Prob > 40 dBZ: Comp Refl | 1 km AGL Refl
- Paintball > 40 dBZ: Comp Refl | 1 km AGL Refl
- Postage Stamps: Comp Refl | 1 km AGL Refl
- Member Viewer: Comp Refl & UH
- Ensemble Mean Fields
- Wind/Height: 250 mb | 300 mb | 500 mb | 700 mb | 850 mb | 925 mb
- Temperature: 250 mb | 300 mb | 500 mb | 700 mb | 850 mb | 925 mb
- Relative Humidity: 700 mb | 850 mb | 925 mb
- Dewpoint: 850 mb | 925 mb
- Relative Vorticity: 500mb
- Ensemble Spread Fields
- Height: 250 mb | 300 mb | 500 mb | 700 mb | 850 mb | 925 mb
- Wind Speed: 250 mb | 300 mb | 500 mb | 700 mb | 850 mb | 925 mb
- Temperature: 250 mb | 300 mb | 500 mb | 700 mb | 850 mb | 925 mb
- Dewpoint: 700 mb | 850 mb | 925 mb
- Precipitable water
- Ens mean | Postage stamps
- Instability
-
Ens Mean:
SBCAPE |
MLCAPE |
MUCAPE
- Ens Max: SBCAPE | MLCAPE
- Prob SBCAPE: > 500 | > 1000 | > 2000 | > 3000
- Postage Stamps: SBCAPE
- LCL / STP/ Echo tops
- Ens Mean: LCL Height
- Sig Tor Parameter (STP): Max | Mean | NEProb > 1 | NEProb > 3
- Echo tops: Max | Mean | Prob matched mean
- Neighborhood prob echo tops: > 30,000 ft | > 35,000 ft
- Wind shear
- Ens Mean: 0-1 km | 0-6 km
- Ens Max: 0-1 km | 0-6 km
- Storm-relative Helicity
- Ens Mean: 0-1 km | 0-3 km
- Ens Max: 0-1 km | 0-3 km
- Prob 0-1 km SRH: > 100 | > 300
- Prob 0-3 km SRH: > 200 | > 450
- Winter Precip
- 1-hr Accumulation
- Snow: Ens Mean | Prob Match Mean | Stamp
- Snow Neighbor Probs: > 1" |
> 2" |
> 3"
- Freezing Rain: Ens Mean | Prob Match Mean | Stamp
- 6-hr Accumulation
- Snow: Ens mean | Ens max
- Freezing rain: Ens mean | Ens max
- 12-hr Accumulation
- Snow: Ens mean | Ens max
- Freezing rain: Ens mean | Ens max
- 24-hr Accumulation
- Snow: Ens mean | Ens max
- Freezing rain: Ens mean | Ens max
- Running total accumulation
- Snow: Ens mean | Prob Match Mean | Stamp
- Snow Neighbor Probs: > 1" | > 3" | > 6" | > 12" | > 24"
- Snow grid-point Probs: > 1" | > 3" | > 6" | > 12" | > 24"
- Freezing rain: Ens mean | Prob Match Mean
- Sleet: Ens mean | Prob Match Mean
- Hourly-max Rotation
- Ens Max cyclonic 2-5 km AGL UH: 4-h windows | 24-h windows
- Ens Max cyclonic 0-3 km AGL UH: 4-h windows | 24-h windows
- Ens Max cyclonic 0-1 km AGL UH: 4-h windows | 24-h windows
- Ens Max anticyclonic 2-5 km UH: 4-h windows | 24-h windows
- Ens Max 1-km AGL vorticity: 4-h windows | 24-h windows
- Paintball: UH > 50 | UH > 75 | UH > 100 | UH > 150
- Neighbor Prob: UH > 50 | UH > 75 | UH > 100 | UH > 150
- Hourly-max Updraft
- Ensemble Max Updraft: 4-h windows | 24-h windows
- Paintball: UP > 10 m/s | UP > 20 m/s
- Neighbor Prob: UP > 10 m/s | UP > 20 m/s
- Hourly-max Downdraft
- Ensemble Max Downdraft: 4-h windows | 24-h windows
- Paintball: DN > 5 m/s | DN > 10 m/s
- Neighbor Prob: DN > 5 m/s | DN > 10 m/s
- Hourly-max 10-m Wind Speed
- Ensemble Max Wind Speed: 4-h windows | 24-h windows
- Paintball: WS > 10 m/s | > 20 m/s | > 30 m/s
- Neighbor Prob: WS > 10 m/s | > 20 m/s | > 30 m/s
- Hourly-max Vert. Int. Graupel
- Ens Max: Graupel
- Paintball >= 1 in: Graupel
- Neighbor Prob >= 1 in: Graupel
- Daily Severe Weather Probs
Ensemble Forecast System Configuration (homepage)
Model forecast configurations are very similar to GFDL's C-SHiELD:
The 204-hour forecasts should complete by 1500 UTC, but graphics may be slower to post. Graphics will be posted to this site as they are available; by 1500 UTC, graphics through at least ~120 hours should be available. Status of the model integration and graphics generation can be found here. Some graphics will likely be missing due to random failures among the enormity of graphics "jobs" we are submitting.
NSF NCAR staff
Craig Schwartz, Ryan Sobash
GFDL staff
Lucas Harris, Kai-Yuan Cheng, Matt Morin, Linjiong Zhou
External Support
NOAA HWT award NA22OAR4590533. These environmental data and related items of information have not been formally disseminated by NOAA and do not represent and should not be construed to represent any agency determination, view, or policy.
Computing
Forecasts are run on NSF NCAR's Derecho supercomputer. Graphics are made on NSF NCAR's Casper cluster. Both systems are maintained by NSF NCAR's Computational and Information Systems Lab (CISL). Thanks to CISL for help facilitating the computing.
Contact
ensemble AT ucar DOT edu
Model forecast configurations are very similar to GFDL's C-SHiELD:
- FV3-based forecasts initialized daily at 0000 UTC
- 10 ensemble members
- 3-km horizontal grid spacing over the CONUS; 13-km grid spacing over the rest of the globe:
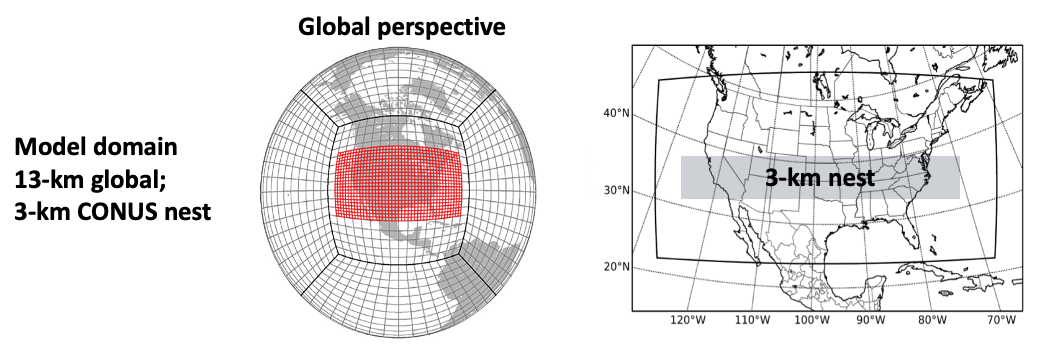
- 204-hour forecasts
- Initial conditions provided by downscaling members 1-10 from NCEP's GEFS initial conditions
- Physics:
- GFDL v2 microphysics
- TKE-EDMF planetary boundary layer scheme
- NOAH-MP land surface model over CONUS; NOAH over the rest of the globe
- RRTMG radiation scheme
- Scale-aware Simplified Arakawa-Schubert (shallow and deep) cumulus scheme; deep convection on
global domain only
The 204-hour forecasts should complete by 1500 UTC, but graphics may be slower to post. Graphics will be posted to this site as they are available; by 1500 UTC, graphics through at least ~120 hours should be available. Status of the model integration and graphics generation can be found here. Some graphics will likely be missing due to random failures among the enormity of graphics "jobs" we are submitting.
NSF NCAR staff
Craig Schwartz, Ryan Sobash
GFDL staff
Lucas Harris, Kai-Yuan Cheng, Matt Morin, Linjiong Zhou
External Support
NOAA HWT award NA22OAR4590533. These environmental data and related items of information have not been formally disseminated by NOAA and do not represent and should not be construed to represent any agency determination, view, or policy.
Computing
Forecasts are run on NSF NCAR's Derecho supercomputer. Graphics are made on NSF NCAR's Casper cluster. Both systems are maintained by NSF NCAR's Computational and Information Systems Lab (CISL). Thanks to CISL for help facilitating the computing.
Contact
ensemble AT ucar DOT edu