 Vortex Following Domain Example Vortex Following Domain Example
For this case study we are going to use the the Hurricane Katrina Case - this only works for tracking cyclones
Case dates are 2005-08-29_00 to 2005-08-30_00, and data
are available 6-hourly.
Source Code
For this case you have to get the pre-compiled code, which was compiled with the vortex following capability.
Set-up WPS
- Make sure you are in the WPS directory.
- Edit namelist.wps to configure the simulation domain and produce input data files
for the WRF model.
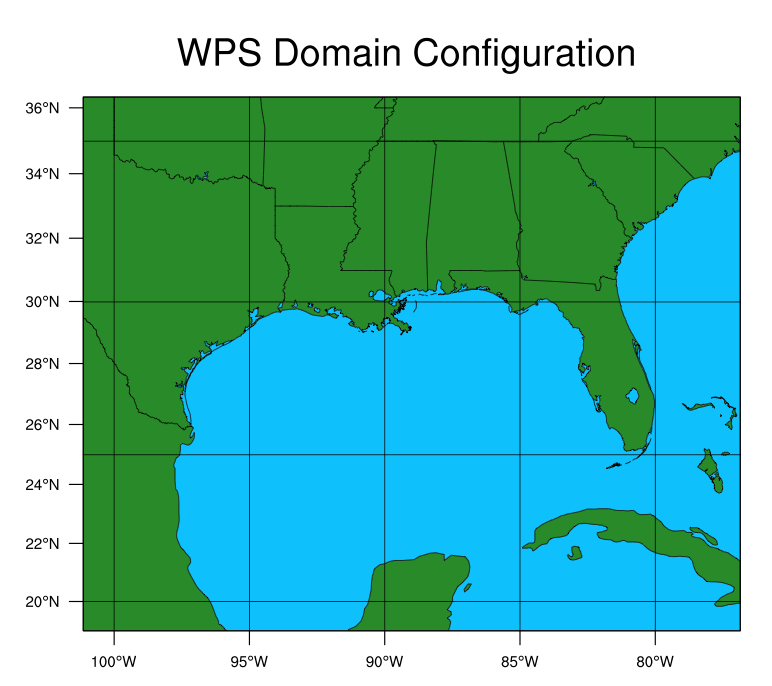
We are going to create a single domain over the Gulf of Mexico - the nest will be added when we run WRF.
The domain size will be 98x70 grid points, with a grid resolution of 30km. We will use a Mercator projection.
- Make the following changes to the namelist.wps file:
max_dom = 1,
start_date = '2005-08-28_00:00:00',
end_date = '2005-08-29_00:00:00',
interval_seconds = 21600,
i_parent_start = 1,
j_parent_start = 1,
e_we = 91,
e_sn = 74,
dx = 30000,
dy = 30000,
map_proj = 'mercator',
ref_lat = 28.00
ref_lon = -89.00
truelat1 = 0.0,
truelat2 = 0.0,
stand_lon = -89.00
geog_data_path =
- geo_data_path: Make sure to set the path to the geogrid static input data to point to the location on the classroom machines.
- Some basic descriptions of the namelist variables are available from the OnLine Tutorial page (geogrid ; ungrib ; metgrid)
- More detailed information is available in Chapter 3 of your ARW User's Guide
- Run plotgrids.ncl (located in the ./util/ directory) to see where your grid is located:
ncl util/plotgrids.ncl
This program reads the grid location
from namelist.wps (namelist record &geogrid)
and creates a grid plot.
Run geogrid
Configure the model grid and generate
the geographical data file "geo_em.d01.nc" by running the program geogrid.exe:
./geogrid.exe
Run ungrib
Run metgrid
Interpolating external model
data to your model grid (created by geogrid and ungrib),
and create input data for WRF by running the program metgrid.exe:
./metgrid.exe
This will create a number of files:
met_em.d01.2005-08-28_00:00:00.nc
met_em.d01.2005-08-28_06:00:00.nc
met_em.d01.2005-08-28_12:00:00.nc
met_em.d01.2005-08-28_18:00:00.nc
met_em.d01.2005-08-29_00:00:00.nc
Try the netcdf data browser 'ncview' to quickly
examine your data files from metgrid.
Set-up WRF
- Make sure you are in the WRFV3_VORTEX directory.
- cd to directory test/em_real
- Edit the namelist.input
file to reflect the domain / date information of the Hurricane Katrina
case (NOTE: we are running with 2 domains, although we only created one domain in WPS)
run_hours = 24,
start_year = 2005, 2005,
start_month = 08, 08,
start_day = 28, 28,
start_hour = 00, 00,
end_year = 2005, 2005,
end_month = 08, 08,
end_day = 29, 29,
end_hour = 00, 00,
interval_seconds = 21600,
input_from_file = .true.,.false.,
history_interval = 180,180,
frames_per_outfile = 1, 1,
restart = .false.,
restart_interval = 5000,
max_dom = 2,
e_we = 91, 97,
e_sn = 74, 97,
e_vert =30, 30,
num_metgrid_levels = 27,
num_metgrid_soil_levels = 4,
dx = 30000, 10000,
dy = 30000, 10000,
grid_id = 1, 2, 3,
parent_id = 0, 1, 2,
i_parent_start = 1, 40,
j_parent_start = 1, 10,
parent_grid_ratio = 1, 3,
parent_time_step_ratio = 1, 3,
- input_from_file=.false. for domain 2 indicates that we will NOT be creating input data for domain 2.
- Read more about:
- Set frames_per_outfile to 1 - this will create a new wrfout file for each output time
- The parent_start values are for the initial nest location - make sure your vortex is in this location at start time.
- To learn more about the namelist variables view the OnLine Tutorial page, or
- For more details, see Chapter 5 of your ARW User's Guide
Run real
- Link the metgrid output data
files from WPS to the current directory:
ln
-sf ../../../WPS/met_em* .
- Run the executable real.exe
to produce model initial and lateral boundary files.
If successful,
the following input files for wrf will be created:
wrfbdy_d01
wrfinput_d01
View the log files to ensure the run was successful.
Run wrf
- Run the executable wrf.exe
for a model simulation and forecast.
Running a 12 hour simulation for this case will take a few minutes on the classroom machines.
If successful, this will
generate the following history files (note - there is one file per output time):
wrfout_d01_2005-08-29_00:00:00
wrfout_d01_2005-08-29_03:00:00
wrfout_d01_2005-08-29_06:00:00
wrfout_d01_2005-08-29_09:00:00
wrfout_d01_2005-08-29_12:00:00
wrfout_d02_2005-08-29_00:00:00
wrfout_d02_2005-08-29_03:00:00
wrfout_d02_2005-08-29_06:00:00
wrfout_d02_2005-08-29_09:00:00
wrfout_d02_2005-08-29_12:00:00
Check your output:
- Check to see what is printed to the log files.
- Tail the log files and look for "SUCCESS
COMPLETE WRF".
- Try the netcdf data browser 'ncview'
to examine your wrf output file
- Generate graphics with one of the supplied packages.
If this was successful, you can continue to run another practical example. |