Plotting MPAS-A Global Simulations
Plotting with Python
Python is NSF NCAR’s primary language for scripting and visualization. See the MPAS Plotting GitHub repository that hosts examples and tutorials on using Python to create MPAS-A visualizations.
There, you can find examples of visualization scripts and references to Python visualization modules, including the ‘mpas-patches/mpas_patches.py’ script, which can be useful for plotting individual MPAS grid cells (instead of interpolating to a rectangular latitude and longitude grid).
NCL Scripts
Note
NSF NCAR has discontinued further development of NCL
The NCAR Command Language (NCL) is an interpreted language that may be used for plotting fields in MPAS-Atmosphere’s netCDF input and output files. Several example scripts are provided below as a starting point, and users new to NCL may consult the extensive NCL documentation for examples and complete descriptions of all functions and resources.
MPAS-A users wishing to make their NCL scripts available for use by others are encouraged to contact the MPAS-Atmosphere developers directly via “mpas-atmosphere-help AT googlegroups.com”.
Standard Pressure Level Plots (850, 500, 200 hPa)
These fields are part of the standard model history output.
Other Standard Plots
This data is also part of the standard model history output.
Interpolating MPAS output to a latitude-longitude mesh
MPAS’s unstructured horizontal mesh can often be problematic for some visualization tools to work with, and makes it more difficult to quickly check model input or output fields when trying to track down problems in the model. For these reasons, it can be helpful to interpolate MPAS fields from their native, unstructured mesh onto a regular, rectangular mesh, such as a regular latitude-longitude grid.
- The mpas_to_latlon.ncl script can be used to accomplish this. It is generally run in two stages:
Specify the resolution of the latitude-longitude grid to which the script will interpolate, and run the script to generate remapping weights (i.e., interpolation weights) that will be used in the second step to actually interpolate from the MPAS mesh to the latitude-longitude grid.
Set gen_weights = False and run the script to remap any cell-centered field of your choosing from the MPAS mesh to the latitude-longitude grid.
Generic NCL plotting scripts
Shown below are example plots from each script; please click on the image to download the script.
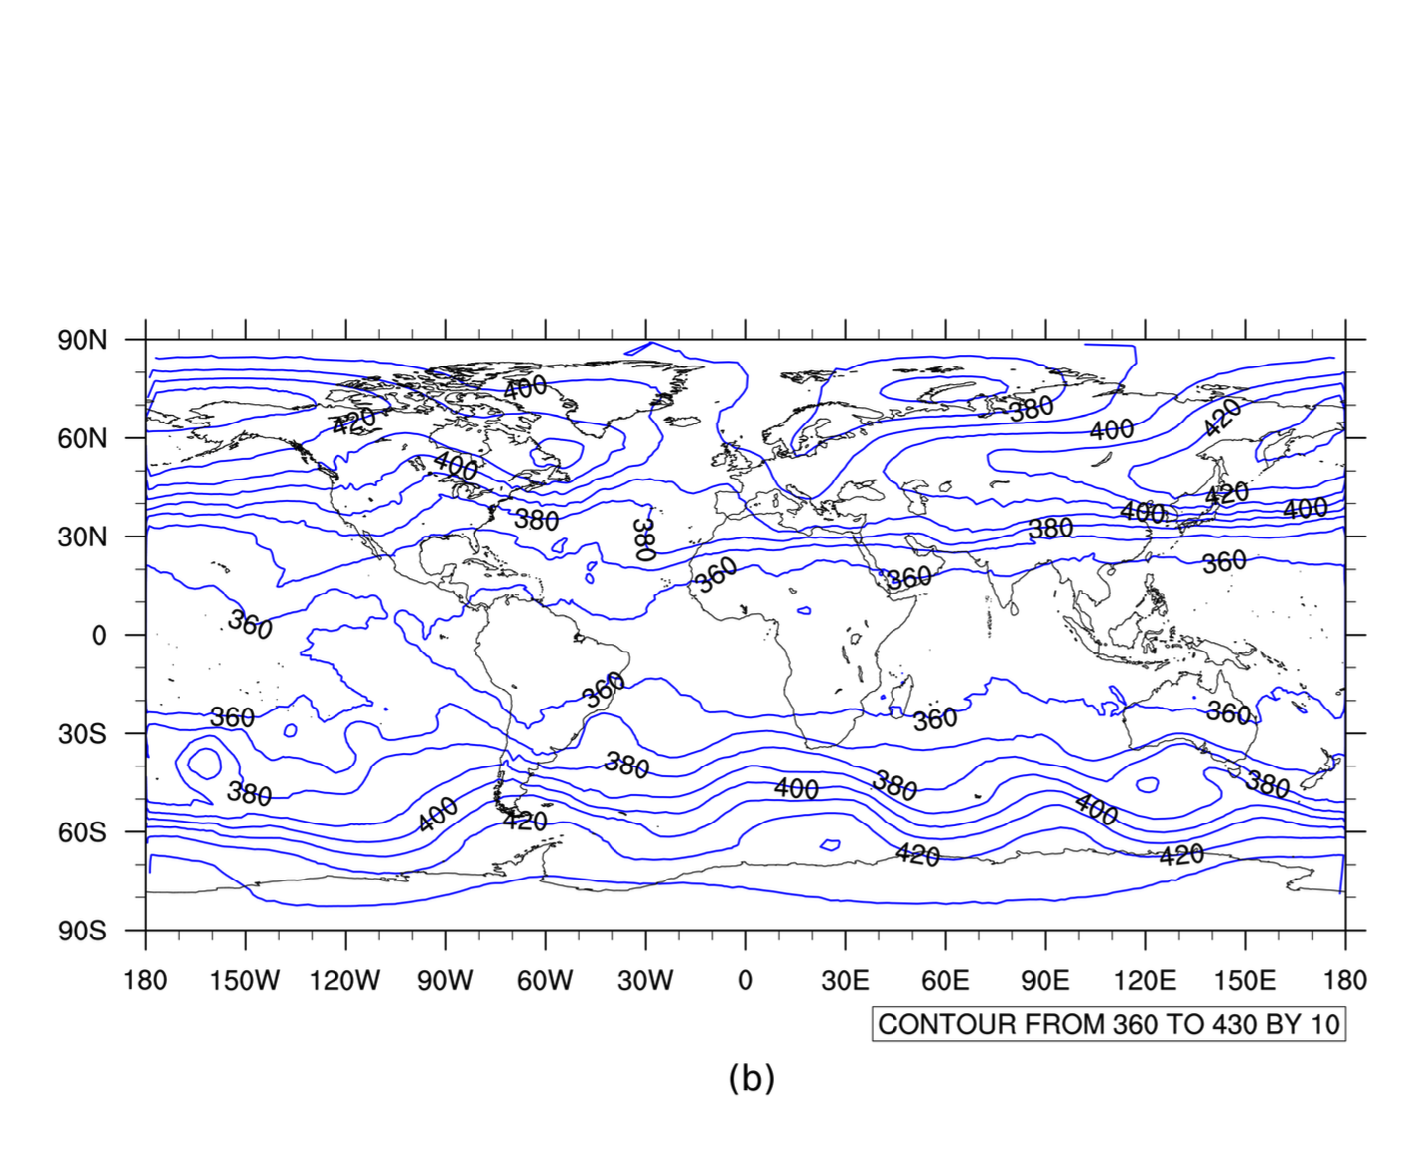
Generic horizontal contour plot
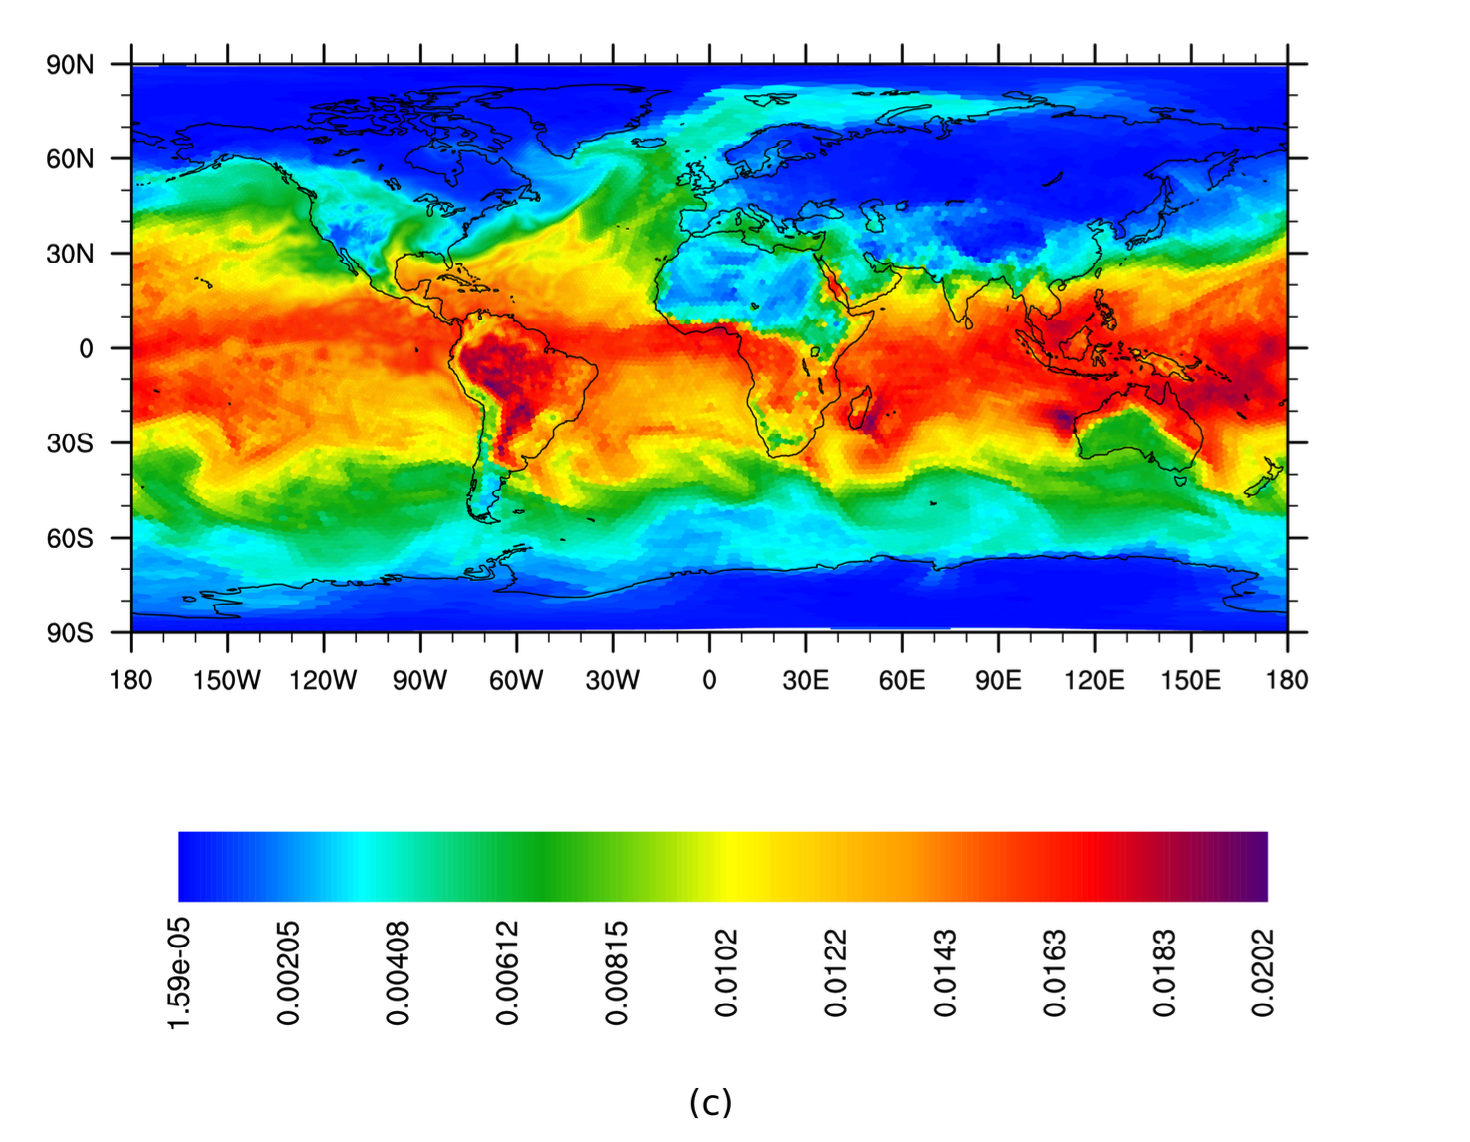
Generic color-filled cell plot
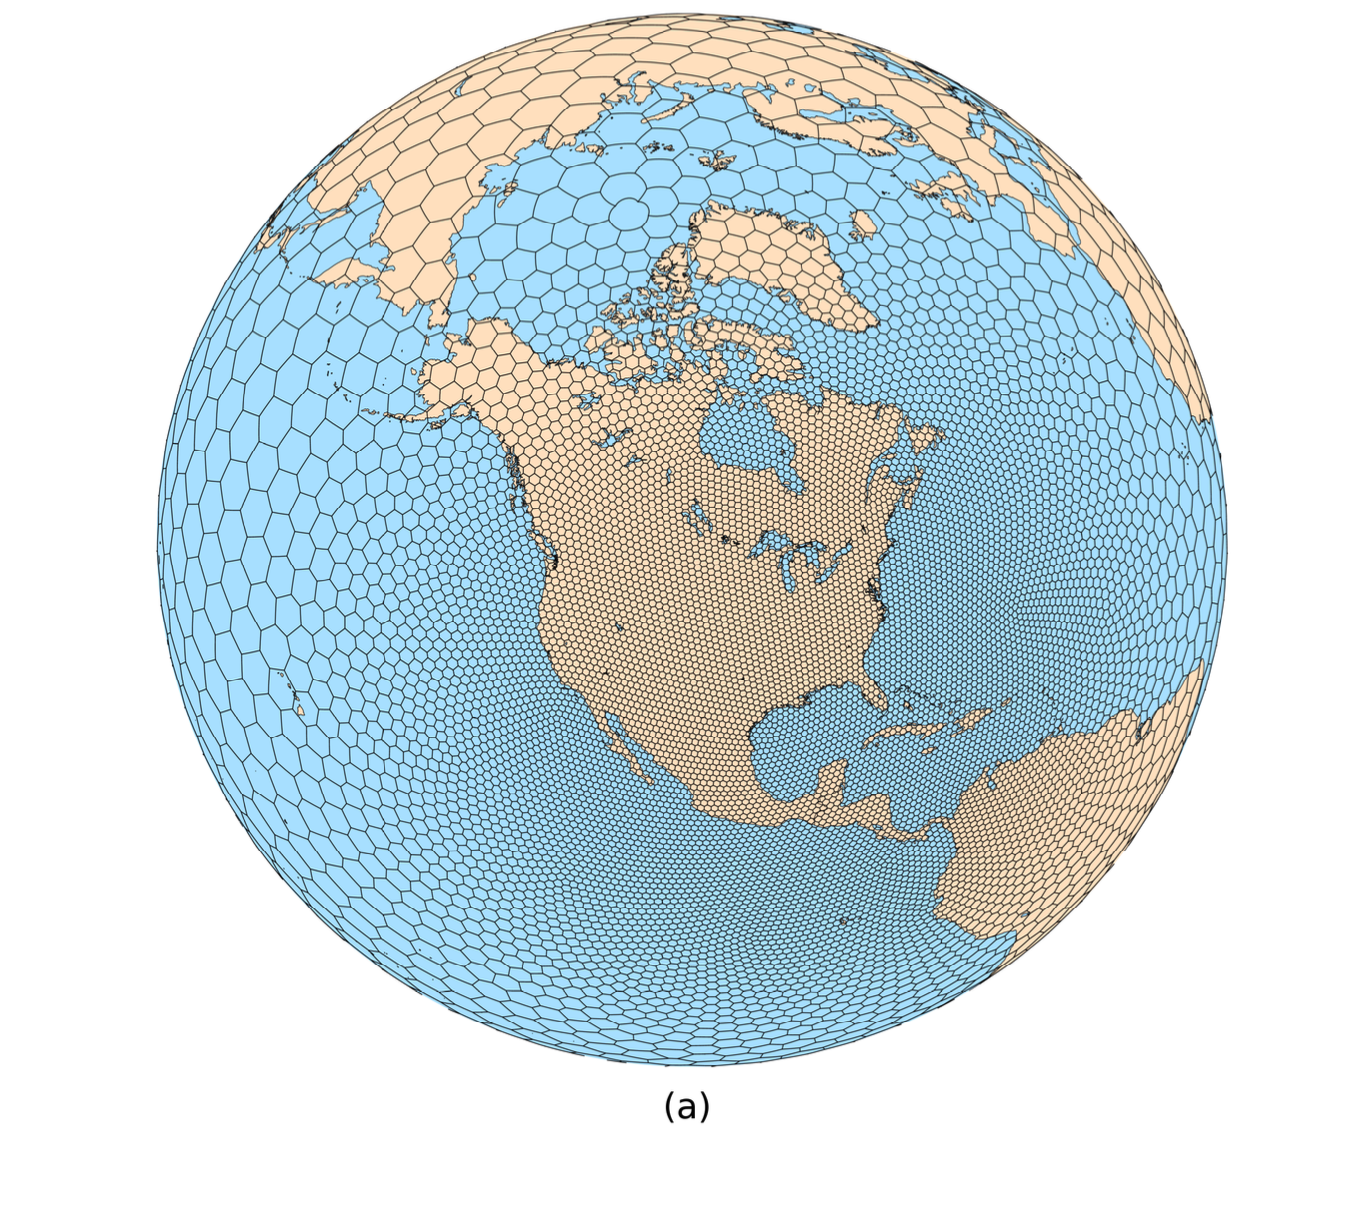
Mesh plot against a map background
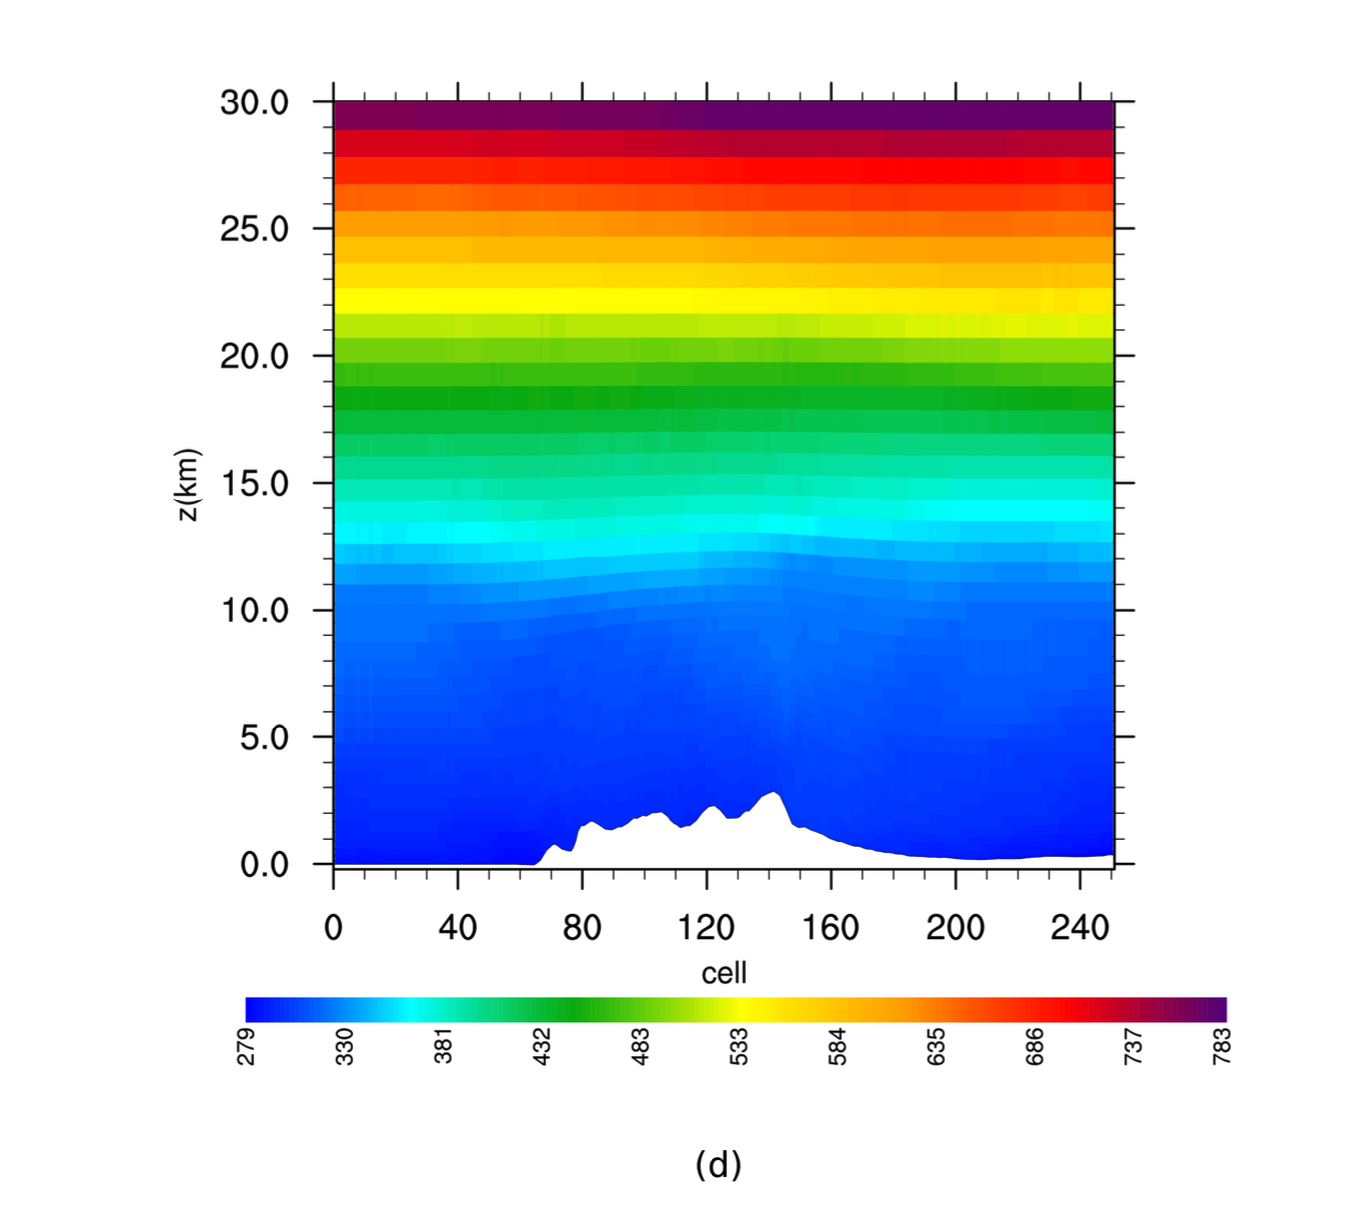
Generic vertical cross section