WRF Physics Suites
WRF physics suites are sets of physics options that perform well for specific applications, supported by sponsoring groups. They guide users in understanding model performance, and facilitating model advancement. Details on NSF NCAR officially-recognized suites are below. See Using Physics Suites for instructions on running WRF with suites.
NCAR Convection-permitting Suite
NSF NCAR’s MMM Lab, which supports the WRF model, has extensive experience running WRF for real-time convective weather forecasting over the Continental US (CONUS). A reliable and accurate WRF setup, known as the NCAR convection-permitting physics suite (CONUS), utilizes a specific combination of physics options for these simulations.
Scheme |
Publication(s) |
Option for &physics record in namelist.input |
|---|---|---|
Thompson microphysics scheme |
mp_physics=8 |
|
MYJ PBL scheme |
bl_pbl_physics=2 |
|
Noah LSM |
sf_surface_physics=2 |
|
RRTMG shortwave and longwave radiation schemes |
ra_sw_physics=4 |
|
Tiedtke cumulus scheme |
cu_physics=6 |
|
MYJ surface layer scheme |
sf_sfclay_physics=2 |
Although the suite is typically used for convection-permitting forecasting with cumulus parameterization deactivated, a cumulus scheme is included for completeness and for coarser grids. The below example uses the NCAR ensemble prediction system that includes both 15-km and 3-km grids.
Use and Applications
NCAR Real-time Forecasting
Since 2003, NSF NCAR’s MMM lab has run real-time, convection-permitting WRF forecasts, starting with the BAMEX campaign (Done et al. 2004). Evaluations, like Weisman et al. 2008 assessed these forecasts, and with respect to the convection-permitting suite, found the MYJ PBL scheme produced a cooler, moister boundary layer more favorable for convection initiation, compared to the YSU scheme. The Thompson microphysics scheme best represented stratiform regions behind squall lines.
The favored set of convection-permitting physics packages has evolved over time to the currently defined convection-permitting suite:
Noah LSM
MYJ PBL
Thompson Microphysics
RRTMG Longwave/Shortwave Radiation
Tiedtke Cumulus Parameterization
Eta/MYJ Surface Layer
Since 2007 MMM has contributed real-time WRF forecasts to the annual Spring Forecasting Experiment (SFE) organized by NOAA’s Storm Prediction Center and the National Severe Storms Laboratory. This has allowed for a long-term examination of WRF’s performance. For example, Coniglio et al. 2010 evaluated various WRF configurations from 2008 SFE modeling groups, finding that at convection-allowing scales (viz., 4-km and 3-km grids) forecasts outperformed coarser operational model precipitation forecasts. Despite a surface and lower tropospheric cold bias, and less-than-observed vertical wind shear and 850-mb moisture over the high plains in all the WRF runs, they suggested errors may be linked to PBL parameterization and the lack of shallow convection parameterization. Schwartz et al. 2010 examined WRF physics scheme combinations in 2007 convection-permitting forecasts, noting differences in precipitation biases, but with the MYJ and Thompson scheme pair showing reasonable biases for low-to-moderate accumulation thresholds. Romine et al. 2013 further evaluated model physics choices in a continuously-cycled data assimilation system, demonstrating the NCAR convection-permitting suite generally performed well.
NCAR Ensemble Prediction System
NCAR’s Convection-permitting suite has been crucial for MMM’s real-time convection-allowing ensemble prediction system (EPS), documented in the below list of publications. The EPS utilizes the suite in its WRF-based analysis (15-km resolution continuously-cycled ensemble adjustment Kalman filer data assimilation) and high-resolution (3-km) forecast components, with cumulus parameterization off in the latter.
The suite has been used with EPS settings in the following field campaigns”
The Mesoscale Predictability Experiment (MPEX 2013 - Weisman et al. 2015)
The Deep Convective Clouds and Chemistry Experiment (DC3 2012 - Romine et al. 2014)
For ensembles, the 2015-2017 Spring Forecasting Experiment (Clark et al. 2012).
Additionally, the EPS has been used for ongoing MMM real-time WRF forecasting (Schwartz et al. 2015b), in which the suite captures the evolutions and structures of organized convective storms (see, e.g., Powers et al. 2017, CONUS-suite Fig. 3).
Schwartz et al. 2015a found that during MPEX over the central U.S., the suite slightly overpredicted rainfall compared to NCEP Stage IV observations, but that the precipitation spatial patterns demonstrated skill. Subjective and objective evaluations indicated reasonable severe weather forecasts, despite errors in convective timing and location.
Schwartz et al. 2015b expanded on previous work, demonstrating the WRF EPS’s skill when using the suite, in forecasting precipitation and providing severe weather guidance. During three-month forecasts, WRF generally located precipitation correctly and forecast reasonable amplitudes, though it sometimes overpredicted rates above 5.0 mm/hr and underpredicted lower rates. When simulating convective structures, the suite provided valuable guidance in strongly-forced MCS events, with lesser skill for weakly-forced events.
CONUS Suite Testing
MMM scientists have conducted targeted suite testing, using WRFv3.9 and the following configurations:
A convection-permitting (3-km) grid
736 x 676 grid points
Over the central U.S. (CONUS-suite Fig. 1)
40 vertical levels, up to 30 mb
A spring period (May-June 2016)
Forecasts initialized at 0000 UTC and 1200 UTC every three days from 17 May to 10 June
GFS first-guess input
This domain and period were selected for their commonality of severe convective weather and substantial precipitation.
A single-case study compared WRF forecast sensitivity across the following different microphysics schemes:
Thompson (Thompson et al. 2008)
Morrison (Morrison et al. 2009)
WSM6 (Hong and Lim 2006).
WRF 48-hour forecasts were initialized at 0000 UTC 26 May 2016. This case was selected due to its heavy rainfall over a broad area (and regionally, some very heavy rainfall).
Seasonal testing of the CONUS-suite (Fig. 2) compared May-June 2016 WRF forecast precipitation with Stage IV observations. Average 48-hour gridpoint accumulations are shown for the 0000 UTC (upper left) and 1200 UTC (upper right) forecast initializations. After a spin-up period of 6-12 hours in which WRF (expectedly) underforecasts the precipitation, there is good agreement with the observations for both initialization times. The 1200 UTC initializations showed better precipitation performance in the first 30 hours, possibly because 0000 UTC runs missed more of the diurnal precipitation cycle due to being earlier in the spin-up phase. For both initializations, as the lead time increases, the influence of initial condition wanes. Lastly, the bottom panel in CONUS-suite Fig. 2 shows the average model-observed gridpoint precipitation amount bias, with close-to-zero bias after the spin-up period.
Results from the 26 May 2016 case comparison of the convective suite with the four microphysics schemes are presented in CONUS-suite Fig. 3 and CONUS-suite Fig. 4. CONUS Figure 3 shows the spatial distributions of precipitation across the simulations for a 24-hour period after a model spin-up period of 12 hours. Thus, accumulations correspond to hours 12-36 of the forecasts (1200 UTC 26 May - 1200 UTC 27 May 2016). The microphysics scheme for each run is noted in the panel tops, with the Stage IV data in the bottom panel. Model accumulation patterns overall are consistent with observations. However, the center of heaviest precipitation in southeastern Texas, along the Gulf Coast is shifted northward relative to that observed in all simulations except the WSM6 experiment, where the center is located more inland compared to the observations. Similarly, with the observed precipitation center in the Midwest, the model counterpart is shifted northward relative to the observations in all four experiments.
CONUS Fig. 4 shows the bias and fractions skill score (FSS) metrics for the 24-hr period examined above. The FSS neighborhood was set at 60 km. The Thompson microphysics selection generally shows better bias and FSS scores than the P3 scheme, but not as good as Morrison and WSM6. All four schemes perform better for lighter precipitation. For heavy precipitation, the Thompson scheme underestimates frequency, while the other three schemes overestimate it.
Note that these microphysics comparison results are for a single case for which the Stage IV observations indicate local precipitation (in eastern Texas) up to 452.9 mm/24 hr for the 1200 UTC 26 May - 1200 UTC 27 May period. Such heavy rainfall makes for a forecast challenge for WRF; however, the microphysics scheme comparison indicates some basic target suite performance, relative to its variations, and an exhaustive inter-scheme comparison is not the purpose here. Systematic experiments of various cases/scenarios would be necessary to provide a comprehensive picture of the relative performance of the different microphysics schemes within the convection-permitting suite.
CONUS Suite Figures
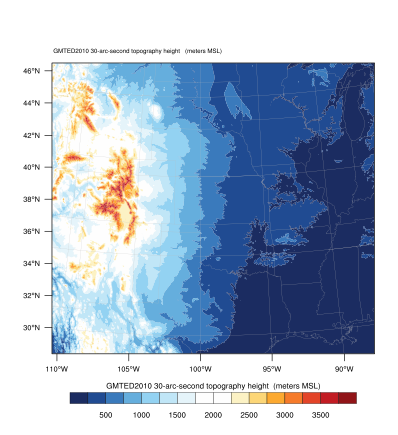
CONUS-suite Fig. 1 : WRF domain used for testing of suite for Spring 2016 period. Grid spacing: 3km. Terrain shaded (m,MSL).
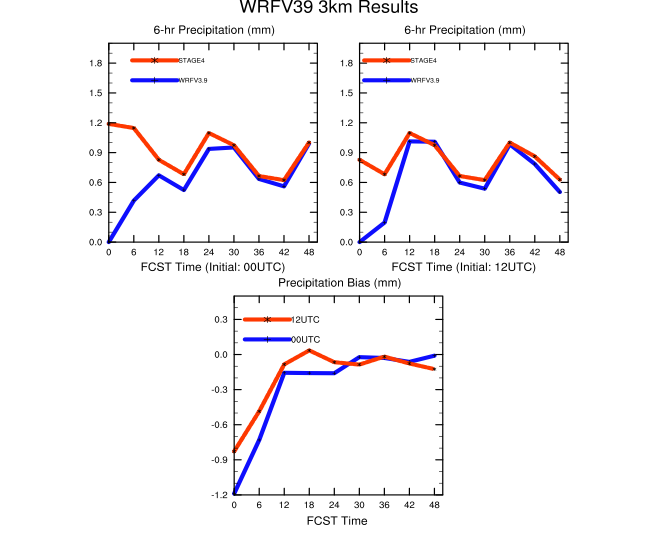
CONUS-suite Fig. 2 : Comparisons of WRF suite test period runs (red) with Stage IV precipitation observations (blue) across forecast hours 0-48. Upper left: Average gridpoint accumulation (mm) across model domain for forecasts initialized at 0000 UTC. Upper right: Average gridpoint accumulation (mm) across model domain for forecasts initialized at 1200 UTC. Bottom panel: Difference (mm) of average gridpoint accumulations for WRF suite runs (red) and Stage IV observations (blue).
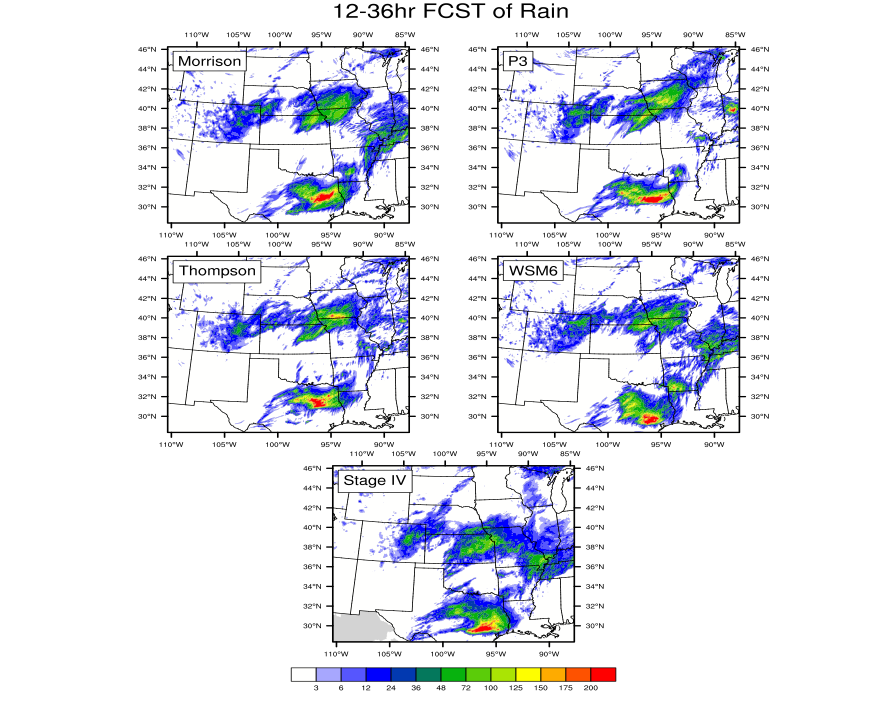
CONUS-suite Fig. 3 : 24-hr precipitation accumulations from WRF runs for 26 May 2016. Period plotted: forecast hours 12-36, 1200 UTC 26 May - 1200 UTC 27 May 2016. Stage IV analysis for the period shown in bottom panel. Precipitation amounts in mm/24 hr.
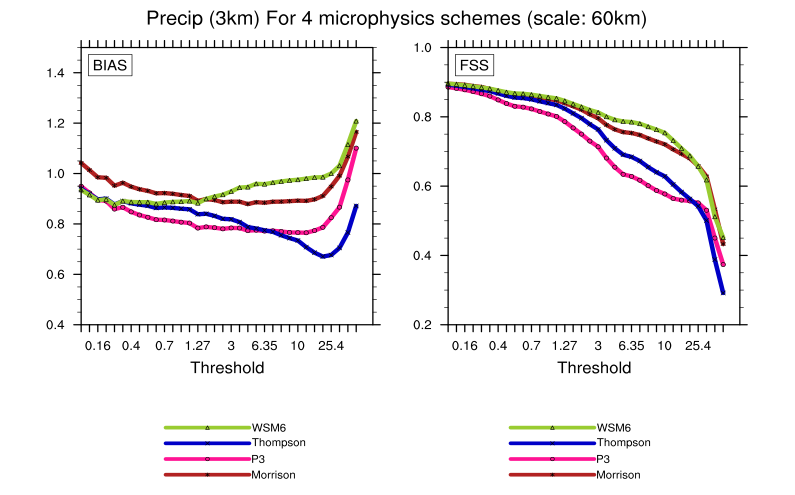
CONUS-suite Fig. 4 : Bias (left) and fractions skill score (FSS) (right) metrics for the 24-hr forecast period from WRF runs for 26 May 2016. Period plotted: forecast hours 12-36, 1200 UTC 26 May - 1200 UTC 27 May 2016. The FSS neighborhood was set at 60 km.
NCAR Tropical Suite
NCAR has conducted real-time tropical cyclone forecasts using the WRF model since 2003. These experimental forecasts are used to evaluate model capability in forecasting the track and intensity of the tropical storms. From 2008 to 2012, NCAR joined NOAA’s HFIP program and provided forecasts to the National Hurricane Center as part of the experimental forecast product. The physics options used in these forecasts evolved in time, and settled down during the HFIP experiment. It consists of the following:
a modified Tiedtke convection scheme (Zhang et al. 2011)
RRTMG long- and short-wave schemes
WSM6 microphysics
YonSei University PBL scheme
MM5 surface layer scheme
Noah Land surface model
Early modeling results were published in Davis et al. 2008, and testing and evaluation to switch the cumulus convection scheme from Kain-Fritsch to Tiedtke was reported in Torn and Davis 2012.
In 2013 and 2014, this physics suite was used in the Model for Prediction Across Scales (MPAS) to test the model’s capability to forecast tropical cyclones in all three Northern Hemispheric Basins. Tests showed the forecast track was comparable to that from GFS. However, some issues were found with this physics suite in the tropics, such as over-prediction of tropical rainfall, and a large number of false alarms for tropical cyclone genesis. Details of the evaluation can be found in Davis et al. 2016.
In 2015, testing began on the newer Tiedtke cumulus scheme (Zhang and Wang 2017), which showed forecast improvement; thus, the Tropical suite now uses the newer Tiedtke scheme. The MPAS testing results are documented here. Since WRF and MPAS share many similar characteristics in dynamics and numerics, it is believed the test results from MPAS can be extended to WRF, at least in the mesoscale range. Therefore this suite is designated as the “NCAR tropical suite” (called the “mesoscale_reference” suite in MPAS), with the following choices of physics:
Scheme |
Publication(s) |
Option for &physics record in namelist.input |
|---|---|---|
WSM6 microphysics scheme |
mp_physics=6 |
|
YSU PBL scheme |
bl_pbl_physics=1 |
|
Noah LSM |
sf_surface_physics=2 |
|
RRTMG shortwave and longwave radiation schemes |
ra_sw_physics=4 |
|
New Tiedtke cumulus scheme |
cu_physics=16 |
|
MM5 surface layer scheme |
sf_sfclay_physics=91 |
In addition tests discussed above, the contributors of the two Tiedtke schemes tested this suite of physics in their regional climate work and found the outcome to be satisfactory (Zhang et al. 2011, Zhang and Wang 2017).
Testing Results with MPAS
Tropical-suite Figure 1 shows the mean track errors from July - Oct, 2016 (left) and 2017 (right) for the Western Pacific Basin at 15 km model resolution. The track forecast from MPAS using the tropical suite for up to 8-days of leading time is comparable to that from GFS.
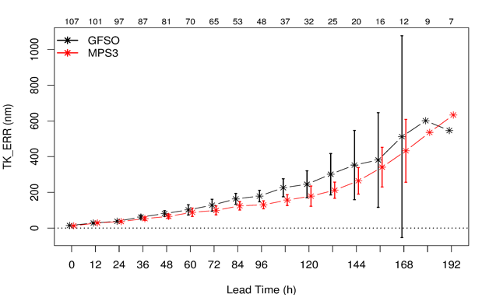
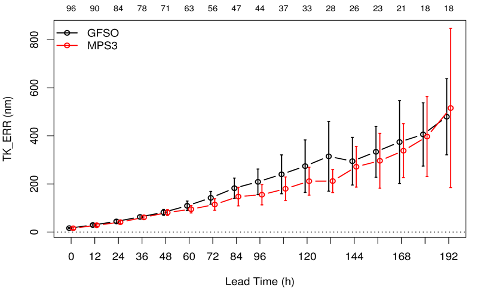
Tropical-suite Fig. 1 : The mean track errors for all tropical storms from July to October in the Western Pacific Basin in 2016 (top) and 2017 (bottom).
The 2017 Atlantic Basic mean track forecast is presented in Tropical-suite Fig. 2. Again, the track errors are comparable to that from the GFS. Larger forecast errors in one or two storms in day 7 and 8 of MPAS forecast results in poorer performance in the late forecast period.
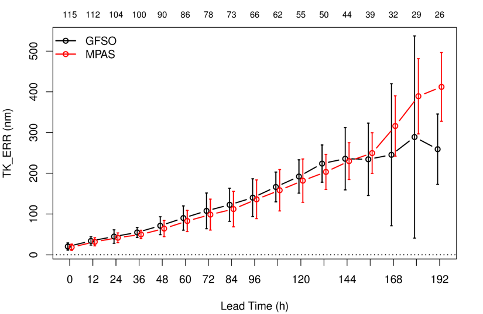
Tropical-suite Fig. 2 : The mean track error for all tropical storms from July to October 2017 in the Atlantic Basin.
The model is also able to predict mean tropical rainfall reasonably well. Tropical-suite Figure 3 shows the monthly mean day-5 predicted rainfall from MPAS and CMORPH for Sept 2017. The model captures the overall precipitation distribution and magnitude fairly well. There is an over-prediction of rainfall over the Western Pacific, and under-prediction over eastern Atlantic, however.
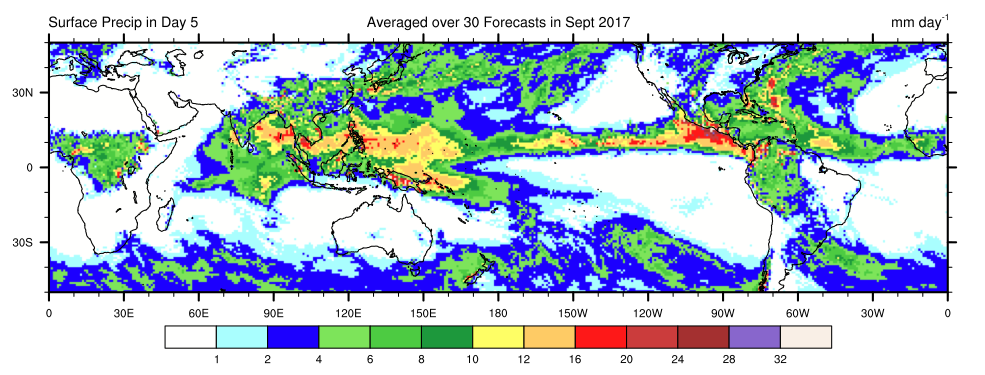
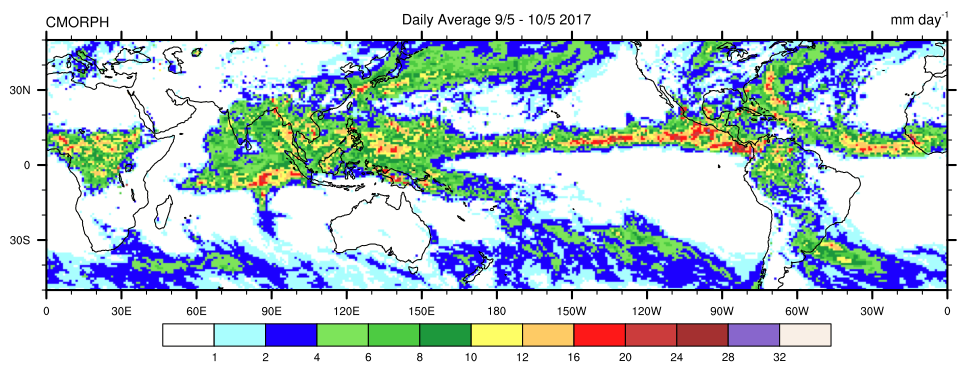
Tropical-suite Fig. 3 : Monthly mean day-5 predicted rainfall (upper panel) and CMORPH for Sept 2017.
The model’s predicted anomaly correlation coefficient (ACC) is also computed and shows that the model has reasonable skill in predicting large-scale flows when compared from the same score from GFS (Tropical-suite Fig. 4).
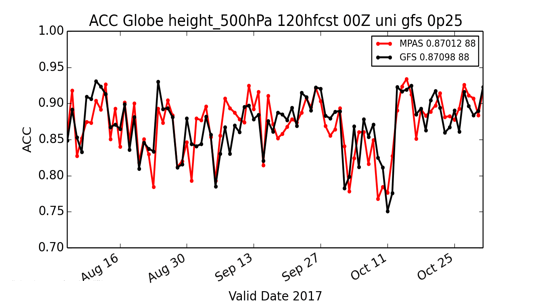
Tropical-suite Fig. 4 : Daily ACC for 500 hPa geopotential height from August 1 to October 31, 2017. The red line is the result from MPAS, and black from GFS.
Find additional details about these testing and evaluation results in:
Wang, W., D. Ahijevych, C. Davis, and B. Skamarock, 2018: Performance of MPAS for tropical cyclone prediction in 2016 and 2017 seasons. The 33rd Conferences of Hurricane and Tropical Meteorology, April 16-20, Ponte Vedra, Florida.
WRF Testing
A case from August 25, 2014 was simulated with WRFv3.6.1 using multiple cumulus schemes. The grid resolution is 30 km, and the model domain covers an area of 16650 km by 7350 km over the Western Pacific. Tropical-suite Figure 5 shows day-3 precipitation from the simulations using a modified Kain-Fritsch scheme for scale-awareness (middle plot) and the Tiedtke scheme (bottom) over a sub-domain area. The top figure is the observed precipitation from CMORPH.
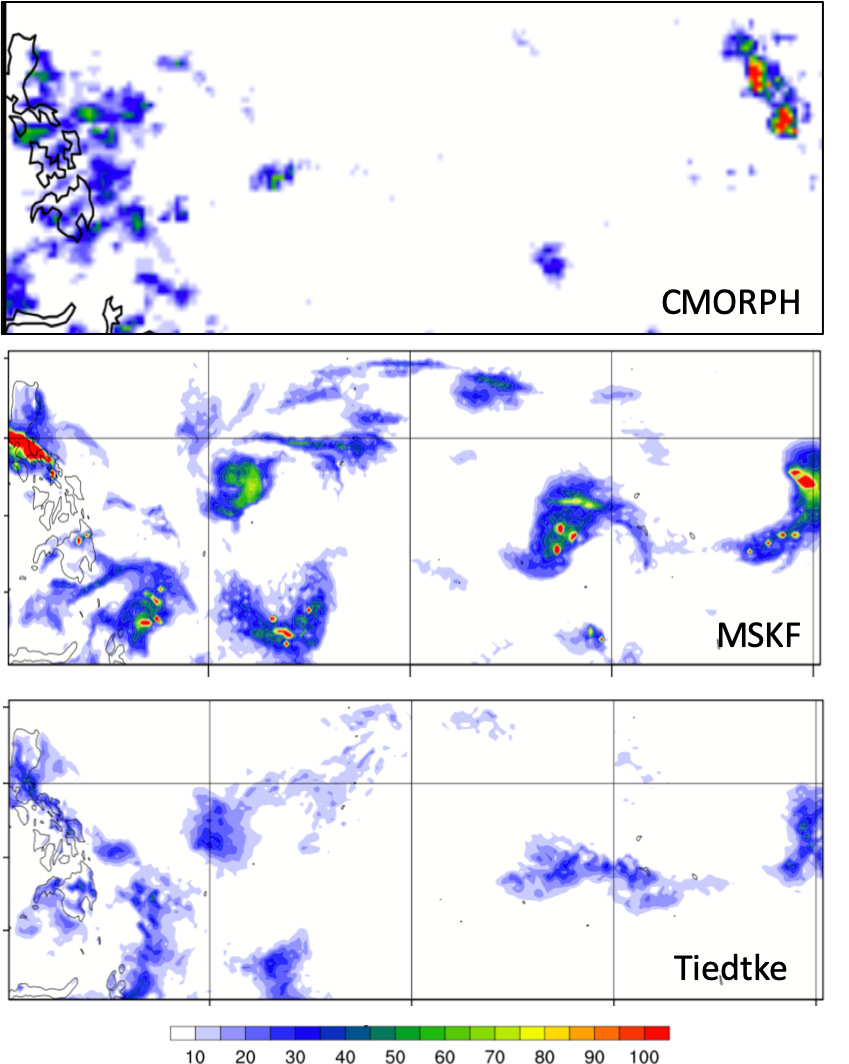
Tropical-suite Fig. 5 : 3-day precipitation for 25 August, 2014 WRF simulations; (Top) observed precipitation from CMORPH; (middle) using modified Kain-Fritsch scheme for scale awareness; (bottom) using the Tiedtke scheme.
The simulated rainfall is significantly over-estimated by the Kain-Fritsch scheme in terms of area coverage (the bullseye from the simulation are an artifact of the modification for scale-awareness). Precipitation from the Tiedtke run compares better with the observed rainfall, though it may under-estimate the rainfall near the eastern part of the sub-domain. The time series of the domain-averaged 6-hourly precipitation from the new Tiedtke, Kain-Fritsch (not the scale-aware version) and Grell-Freitas is presented in Tropical-suite figure 6. It shows that rainfall produced by the Kain-Fritsch and Grell-Freitas schemes may be excessive for this case. Reduced precipitation over the tropical area by the new Tiedtke scheme is consistent with what is seen in MPAS.
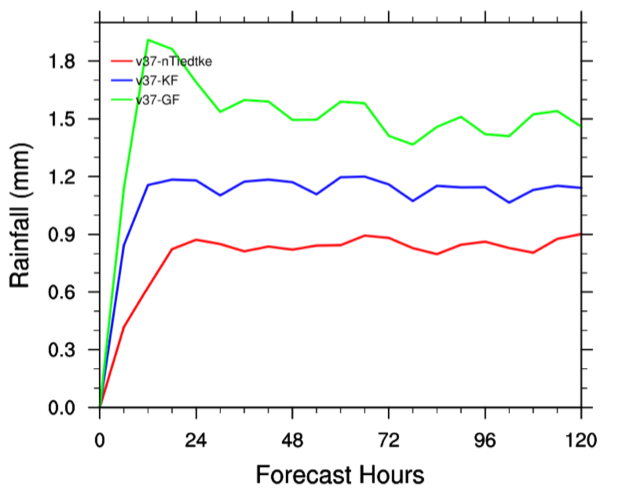
Tropical-suite Fig. 6 : Time series of the domain-averaged 6-hourly precipitation from the new Tiedtke, Kain-Fritsch (not the scale-aware version) and Grell-Freitas.
A comparison of the new Tiedtke scheme versus the old Tiedtke, Kain-Fritsch and Betts-Miller-Janjic schemes in simulating tropical cyclones can be found in a paper by Zhang and Wang 2018.