Single Domain Run
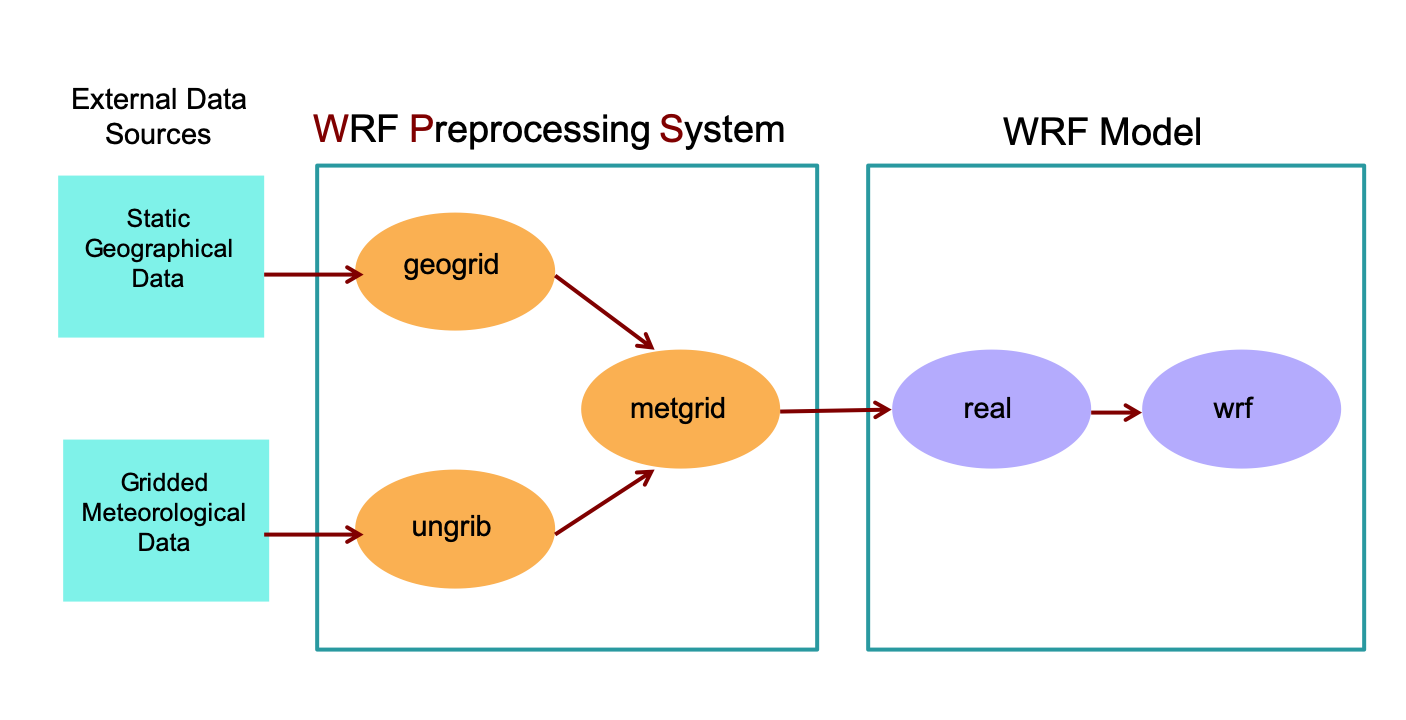
Using the below flowchart, repeat the same process from the initial practice exercise, while learning more about namelist parameter setup.
Move to the wps directory to run the WPS programs.
cd /glade/derecho/scratch/$USER/practice_exercises/wps
Before getting started, save all files created in the initial exercise to a new directory, and remove files no longer needed.
mkdir initial_exercise

mv met_em* FILE* geo_em.d01.nc initial_exercise

rm GRIBFILE*
WPS: Geogrid
geogrid
A WPS program that defines the model domains’s map projection, geographic location, size, and resolution. It also interpolates static geographic data (e.g., topography height, landuse category, etc.) to the domain.
From the wps directory, use vi or gedit to edit namelist.wps as is listed below to configure the simulation domain. If you are not familiar with vi, use gedit, which is a simple editor. For e.g.,
gedit namelist.wps

vi namelist.wps
Geogrid reads the &share and &geogrid records in namelist.wps. The following are specifications for this domain, but are listed specifically as they should be input to the namelist further below:
A single domain over the eastern half of the United States
Domain size: 100 x 100 grid points (e_we and e_sn)
Resolution: 30 km (dx and dy)
Projection: lambert
Make the following settings in the namelist:
Note
Some namelist parameters require domain-specific settings, while others require only a single value. For single domain cases (max_dom=1), only configure the first column. Do not remove entries in other columns.
&share
max_dom = 1,

&geogrid
e_we = 100,
e_sn = 100,
dx = 30000
dy = 30000
map_proj = 'lambert',
ref_lat = 38.00
ref_lon = -90.00
truelat1 = 30.0
truelat2 = 60.0
stand_lon = -90.00
geog_data_path = '/glade/work/wrfhelp/WPS_GEOG'
See also
If interested, see additional namelist.wps details, or the Best Practice namelist for WPS.
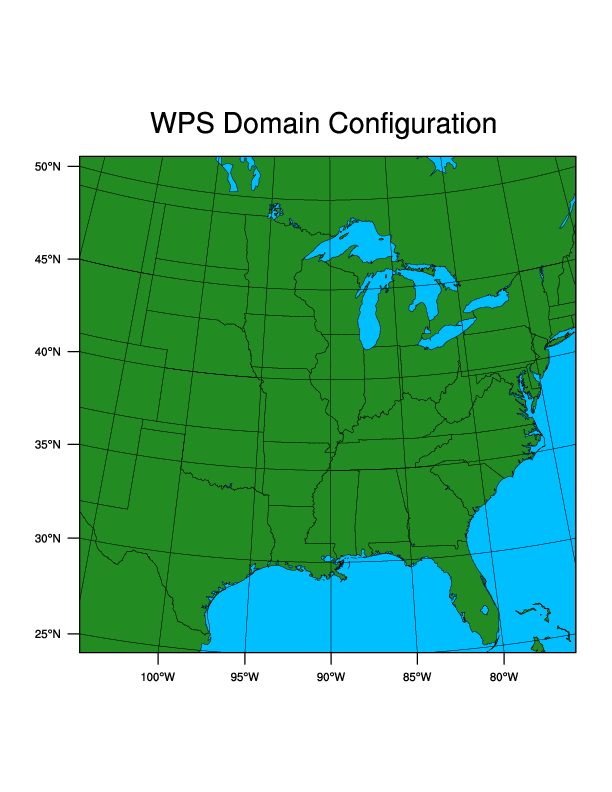
Verify the domain is correct, using the wps/util/plotgrids_new.ncl script.
Important
X11–forwarding is required to view plots directly from Derecho.
WRF INSTRUCTORS CANNOT HELP WITH THIS INSTALLATION!
Contact your institution’s systems administrator for assistance or see Visualization Without X-forwarding.Issue the following command:
ncl util/plotgrids_new.ncl
The following plot should pop up on the screen (this may take several seconds). Click the image, or use “ctrl-c” to close the window.
Note
Plotgrids default output format is x11. Later, to change the format, modify the wps/util/plotgrids_new.ncl script. For example, uncomment the following line to generate a wps_show_dom.pdf file in the current directory.
type = "pdf"
To open the .pdf file on Derecho, use the command
display wps_show_dom.pdf
Run the geogrid.exe program to configure the model grid.
./geogrid.exe
As geogrid processes, status updates are printed to the terminal, following by Successful completion of geogrid when complete. Afterward, a listing of the directory (
ls) should include the following new file:geo_em.d01.nc
Note
A geogrid.log file is generated by geogrid.exe, and can be useful for tracking errors, if needed.
WPS: Ungrib
ungrib
A WPS program program that processes GRIB-formatted meteorological data - a widely used input format. It extracts the relevant meteorological fields from these files and outputs them to an intermediate format compatible with the the metgrid program.
Simulate the severe storm outbreak from March of 2023 in the midwest and southeast US, which resulted in over 1000 severe weather reports, including 188 tornado reports.
The following describes the input data:
Type |
Global one-degree final analysis from the NCEP GFS model |
Interval |
Every 6 hours |
Initial Time |
2023-03-31_00:00:00 |
End Time |
2023-04-01_00:00:00 |
Data Directory |
/glade/campaign/mmm/wmr/wrf_tutorial/input_data/severe_outbreak/ |
File Root |
fnl_20230 |
Vtable |
Vtable.GFS |
Ungrib reads the &share and &ungrib records in namelist.wps. No edits to the &ungrib record are required for this simulation.
Adjust the &share namelist record for the correct time period. Do not delete the second column - ungrib only reads the first column since max_dom=1.
&share

start_date = '2023-03-31_00:00:00 ',
end_date = '2023-04-01_00:00:00 ',
interval_seconds = 21600
Note
interval_seconds : number of seconds between GRIB data intervals. Because these data are available every 6 hours, set interval_seconds=21600.
When running cases for your own research, use high frequency data when possible.
If interested, see details about these namelist parameters.
Link the GRIB data to the current directory using the script link_grib.csh:
./link_grib.csh /glade/campaign/mmm/wmr/wrf_tutorial/input_data/severe_outbreak/fnl_20230
Note
When running the script, omit the period at the end of the command. The script takes care of placing the linked files “here”.
Link directly to the files, not to a directory. Use the file root only, not individual data files. After typing the directory name, use the “tab” key to auto-complete the file prefix.
A directory listing (
ls) should show linked files, GRIBFILE.*xxx* (one for each data file/time period).Because input is from GFS, link the GFS Vtable to the wps directory and rename it to Vtable - the name expected by the ungrib program.
ln -sf ungrib/Variable_Tables/Vtable.GFS Vtable
Ungrib the input data by running ungrib.exe.
./ungrib.exe
As ungrib processes, status updates are printed to the terminal, followed by Successful completion of ungrib when complete. Afterward, a listing of the directory (
ls) should include the following files:FILE:2023-03-31_00
FILE:2023-03-31_06
FILE:2023-03-31_12
FILE:2023-03-31_18
FILE:2023-04-01_00
The data are now in intermediate format and are ready for the metgrid.exe process.
Note
An ungrib.log file is generated by ungrib.exe, and can be useful for tracking errors, if needed.
WPS: Metgrid
metgrid
A WPS program that horizontally interpolates meteorological data extracted by ungrib onto the simulation domain(s) (defined by geogrid), creating input files required by real and wrf.
Note
The &metgrid namelist record is used for this process; however, since we kept this case simple, no namelist changes are needed at this point.
To run the metgrid program, type:
./metgrid.exe
As metgrid processes, status updates are printed to the terminal, followed by Successful completion of metgrid when complete. Afterward, a listing of the directory (ls) should include the following new files:
met_em.d01.2023-03-31_00:00:00.nc
met_em.d01.2023-03-31_06:00:00.nc
met_em.d01.2023-03-31_12:00:00.nc
met_em.d01.2023-03-31_18:00:00.nc
met_em.d01.2023-04-01_00:00:00.nc
Note
metgrid.exe generates a metgrid.log file that can be useful for tracking errors.
The “.nc” file suffix indicates these files are in netCDF format.
If interested, issue the following for a list of file contents:
ncdump -h met_em.d01.2023-03-31_00:00:00.nc
Prep for Real & WRF
Move to the WRF/test/em_real directory.
cd /glade/derecho/scratch/$USER/practice_exercises/wrf/test/em_real
Note
Instead of using the absolute path to point to, or move between directories, try the Unix “..” option, which translates as “the parent directory to the current directory.” For e.g., instead of the above command, from the wps directory, try:
cd ../wrf/test/em_real
Use vi or gedit to modify the namelist.input file to reflect the case’s domain and date information. Do not delete the second column. real.exe and wrf.exe only read the first column since max_dom=1.
&time_control
run_hours = 24,
run_minutes = 0,
start_year = 2023,
start_month = 03,
start_day = 31,
start_hour = 00,
end_year = 2023,
end_month = 04,
end_day = 01,
end_hour = 00
interval_seconds = 21600
history_interval = 180,
frames_per_outfile = 1,
restart = .false.,
restart_interval = 720,

&domains
time_step = 180
max_dom = 1,
e_we = 100,
e_sn = 100,
e_vert = 45,
num_metgrid_levels = 34
num_metgrid_soil_levels = 4
dx = 30000
dy = 30000
Note
How were the values for num_metgrid_levels=34 and num_metgrid_soil_levels=4 determined? Try the commands to find the required values, which come from the met_em* files:
ncdump -h ../../../wps/met_em.d01.2023-03-31_00:00:00.nc | grep -i num_metgrid_levels

ncdump -h ../../../wps/met_em.d01.2023-03-31_00:00:00.nc | grep -i num_metgrid_soil_levels
Ensure restart=.false. for non-restart runs. Setting restart_interval=720 outputs a restart file every 12 hours. Restarts are discussed in a later exercise.
See also
See additional namelist.input details, or the Best Practice namelist for WRF.
Real Program
real
A WRF program that defines the WRF model vertical coordinate by vertically interpolating the horizontal meteorological data from WPS (met_em*). This process creates the initial condition and lateral boundary files required to run WRF.
Link wps metgrid output to the current directory:
ln -sf ../../../wps/met_em* .
Run real.exe to generate model initial condition and lateral boundary files.
Important
Unlike WPS, WRF was compiled for parallel computing (enabling the use of multiple processors). Because the NCAR HPC uses a queueing system, a batch script is required to queue and execute the model on the requested processors.
The real.exe batch script is called runreal.sh. Issue the following command:
qsub runreal.sh
Wait about one minute and then check the request status using the following command:
qstat -u $USER
If the run is still queued or actively running, it will be displayed in the output from the above command, and will look similar to:
                                                            Req'd  Req'd   Elap
Job ID          Username Queue    Jobname    SessID NDS TSK Memory Time  S Time
--------------- -------- -------- ---------- ------ --- --- ------ ----- - -----
1873233.desche* user     cpu      real          --    1  36  235gb 00:20 Q   --
The “S” column above indicates the status, where the following definitions apply:
Q : the run is still sitting in the queue
R : the simulation is actively running
E : the simulation is finishing and will be done momentarily
If no output appears, look for rsl.* files in your directory. If they exist, check the end of one of the files for the message SUCCESS COMPLETE REAL_EM INIT, indicating the program completed successfully.
tail rsl.out.0000
If successful, the following initial condition and boundary files should be in your directory:
wrfbdy_d01
wrfinput_d01
Important
If the following message prints to the screen while running real, the run failed - check the rsl.error.0000 file for the cause.
MPI_ABORT was invoked on rank 0 in communicator MPI_COMM_WORLD with errorcode 1" or "BAD TERMINATION OF ONE OF YOUR APPLICATION PROCESSES
Run WRF
real
The WRF model uses the intitial and boundary condition files generated by the real program to perform model integration, using user-specified options provided in the namelist.input file (e.g., physics options).**
To run wrf.exe, use the runwrf.sh batch script, which queues and executes the wrf simulation.
qsub runwrf.sh
Note
If interested, use an editor to look at runwrf.sh’s contents. The following line indicates you are using a single node with 36 processors for the WRF simulation.
PBS -l select=1:ncpus=36:mpiprocs=36
Completing this simulation should only take a couple of minutes (once it’s out of the queue and running) since the setup is for a small, coarse domain. Wait about one minute and then check the status of your request, using the following command:
qstat -u $USER
If the run is still queued or actively running, it is displayed in the output.
If no output appears, look for rsl.* files in your directory. If they exist, check the end of one of the files for the message SUCCESS COMPLETE WRF, indicating a successful completion.
If successful, the following history files should be available in the running directory. Note that the namelist.input file was set to output every 3 hours:
wrfout_d01_2023-03-31_00:00:00
wrfout_d01_2023-03-31_03:00:00
wrfout_d01_2023-03-31_06:00:00
wrfout_d01_2023-03-31_09:00:00
wrfout_d01_2023-03-31_12:00:00
wrfout_d01_2023-03-31_15:00:00
wrfout_d01_2023-03-31_18:00:00
wrfout_d01_2023-04-01_00:00:00
Note
Recall the namelist parameter restart_interval is set to 720 (or every 12 hours); therefore the following files (which are required for the later Restart exercise) should also be present:
wrfrst_d01_2023-03-31_12:00:00
wrfrst_d01_2023-04-01_00:00:00
Check Your Output
To view the log files (rsl.out.0000), use commands such as gedit, vi, cat, more, or tail, e.g.,:
cat rsl.out.0000
If interested in viewing fields in the wrf output files, try the netCDF data browser ncview:
ncview wrfout_d01*
Note
ncview displays the contents of multiple files, but for only one domain at a time. Though this case only uses a single domain, keep this rule in mind later when running with nests.
In the ncview display box, select a variable type (1d, 2d, or 3d), then a specific field. Browse through time periods and, for 3d variables, view each level. The following fields may be of interest:
RAINC : Accumulated total cumulus precipitation (under the list of “3d vars”)
RAINNC : Accumulated total grid scale precipitation (3d)
SNOWC : Snow coverage (3d)
SNOWNC : Accumulated total grid scale snow and ice (3d)
PSFC : Surface pressure (3d)
Q2/T2 : Water Vapor/Temperature at 2m above ground (3d)
U10/V10 : X/Y Component of wind (speed) at 10m above ground (3d)
MU : Perturbation dry air mass in column (3d)
PH : Perturbation geopotentail (under the list of “4d vars”)
QVAPOR/QCLOUD/QRAIN/QICE/QSNOW : Vapor/Cloud water/Rain water/Ice/Snow mixing ratio (4d)
U/V : X/Y-wind component (speed) (4d)
ncview can be used with other netCDF files - e.g., met_em*.nc or geo_em*.nc files.
Generate graphics using one of the supplied packages, either now or after more practice exercises.
Save Your Output
Create separate directories for each exercise within wrf/test/em_real/ (e.g., “single_domain”) to save and preserve files for later use and avoid overwriting. For e.g.,
mkdir single_domain
and then copy output files into that directory:
cp wrfbdy_d01 wrfinput_d01 namelist.input wrfout* wrfrst* rsl* single_domain
When you need the files later, simply copy them back to the working directory. For example:
cp single_domain/wrfbdy_d01 .
For completeness follow the same approach for the wps output.
cd /glade/derecho/scratch/$USER/practice_exercises/wps

mkdir single_domain

cp namelist.wps met_em* geo_em* FILE* single_domain
Return to the Practice Exercise home page to run another exercise.